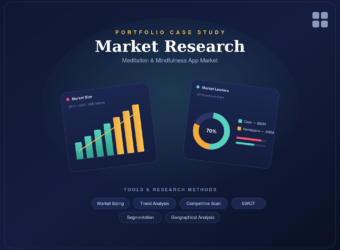
Through in-depth research into the meditation and mindfulness app market, we have uncovered the key trends, leading players, and growth opportunities that can be applied across the fast-expanding wellness technology space.
A concise market study — size, trends, competition, and outlook.
Overview
Meditation apps deliver guided meditation, breathing, and sleep content that helps reduce stress, anxiety, and insomnia. Rising stress levels, wider smartphone use, and growing mental-health awareness are driving rapid adoption. The market is highly consolidated: two players — Headspace and Calm — hold roughly 70% of global share.
Market Size & Forecast
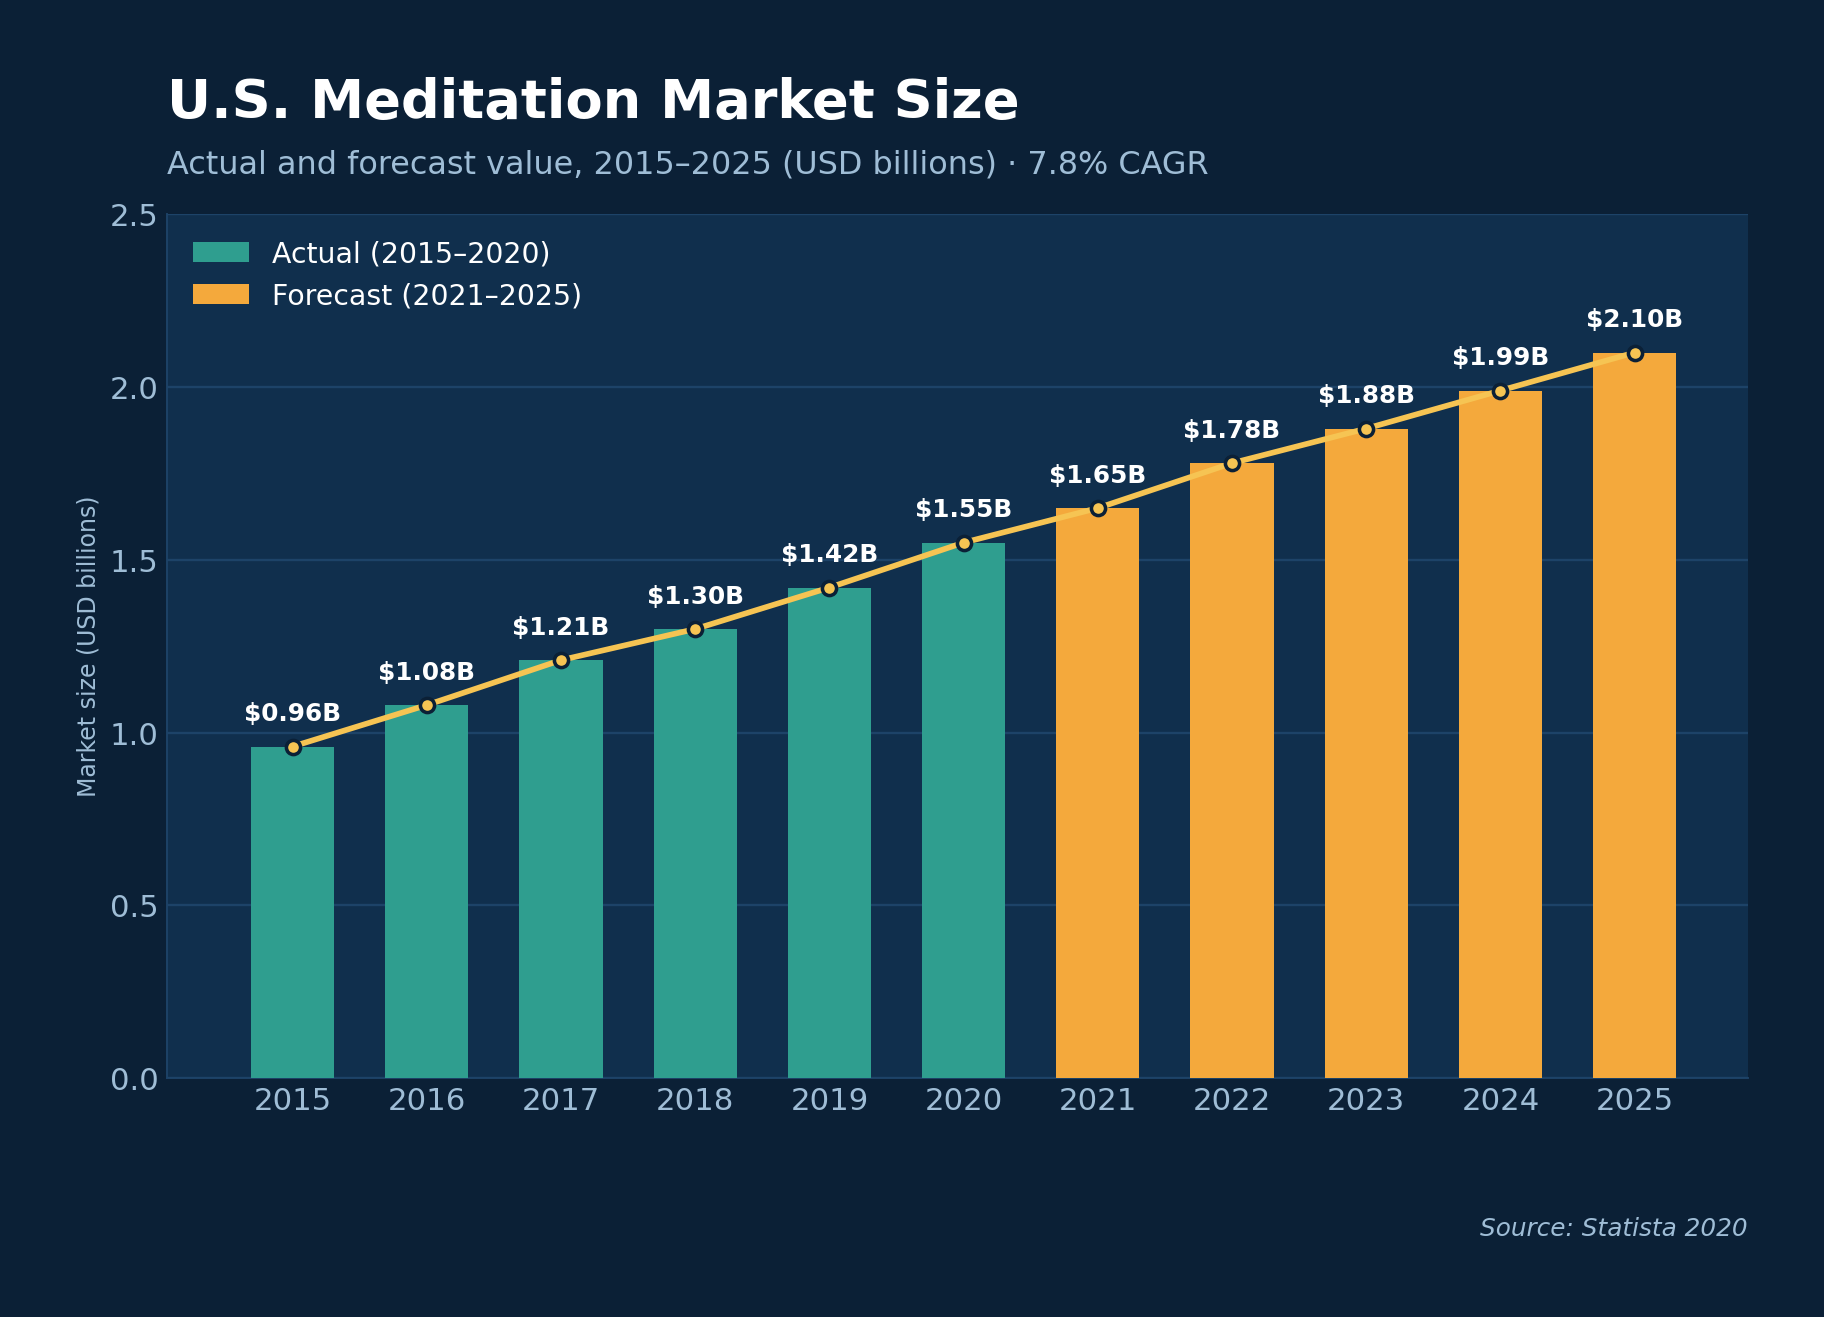
The U.S. meditation market grew from $0.96B in 2015 to $1.55B in 2020, and is forecast to reach $2.1B by 2025 — an estimated 7.8% CAGR. Steady year-on-year growth signals a maturing, expanding category.
U.S. meditation market size, 2015–2025 (USD billions). Source: Statista 2020
Key Trends
~52 million users downloaded the top-10 meditation apps in 2019.
Wider smartphone and smartwatch use makes mindfulness a daily habit.
Aging populations and rising mental-health needs expand the audience — over 53% of U.S. seniors meditate weekly.
Market Snapshot
Market opportunity of USD 2.1B between 2020–2025 (7.8% CAGR).
Meditation practice has tripled since 2012; ~14% of U.S. adults have tried it.
Globally, an estimated 200–500 million people meditate.
Headspace, Calm, and peers have seen 65M+ downloads across 180+ countries.
North America leads today; Asia Pacific is the fastest-emerging region.
Segmentation
By operating system the market splits into iOS, Android, and others, with Android expected to grow fastest. By end-use it covers schools, offices, and personal use — the school segment is projected to lead as providers like Calm and Headspace build classroom products.
Geographical Analysis
North America holds the largest share, driven by high mental-health awareness and regular app use. Asia Pacific shows strong promise as the home of these practices, and the Middle East (GCC) remains a high-growth market for mindfulness apps.
Consumer Demand
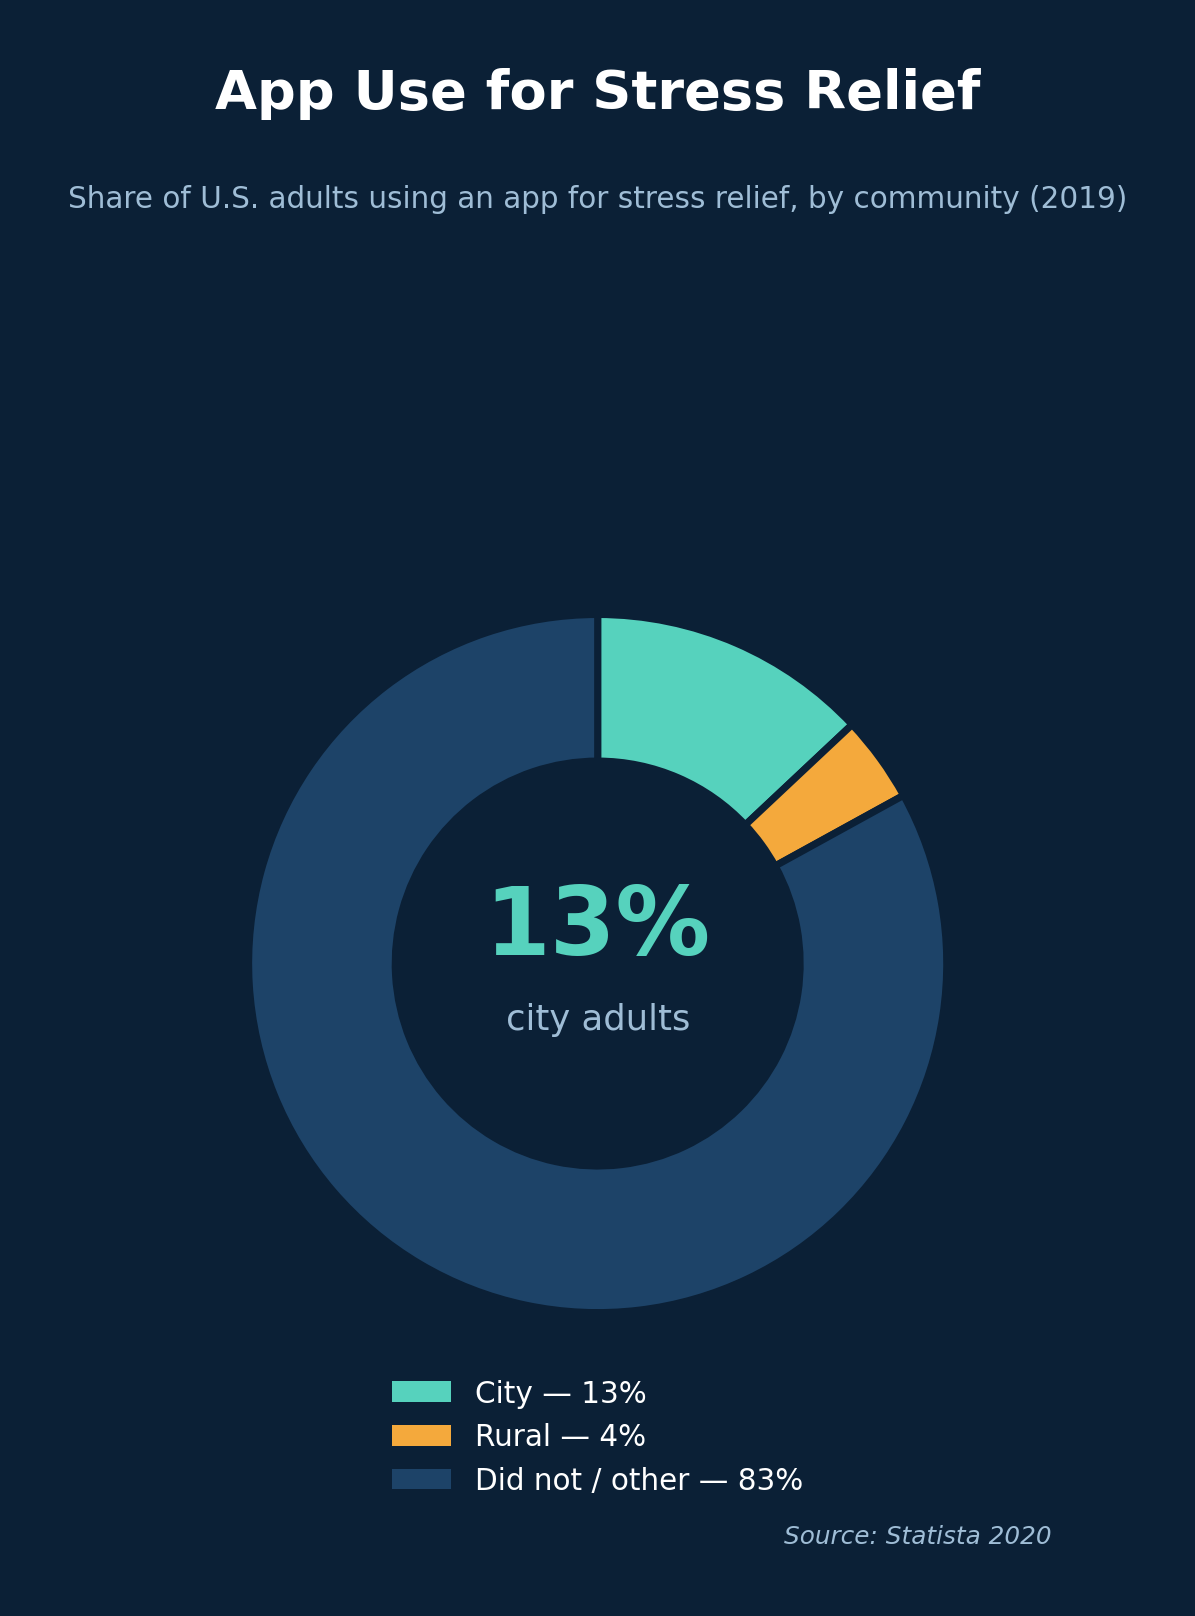
Demand is concentrated in cities: 13% of urban U.S. adults use an app for stress relief, versus just 4% of rural adults — pointing to a clear urban-first growth opportunity.
App use for stress relief, by community (2019). Source: Statista 2020
Competitive Analysis
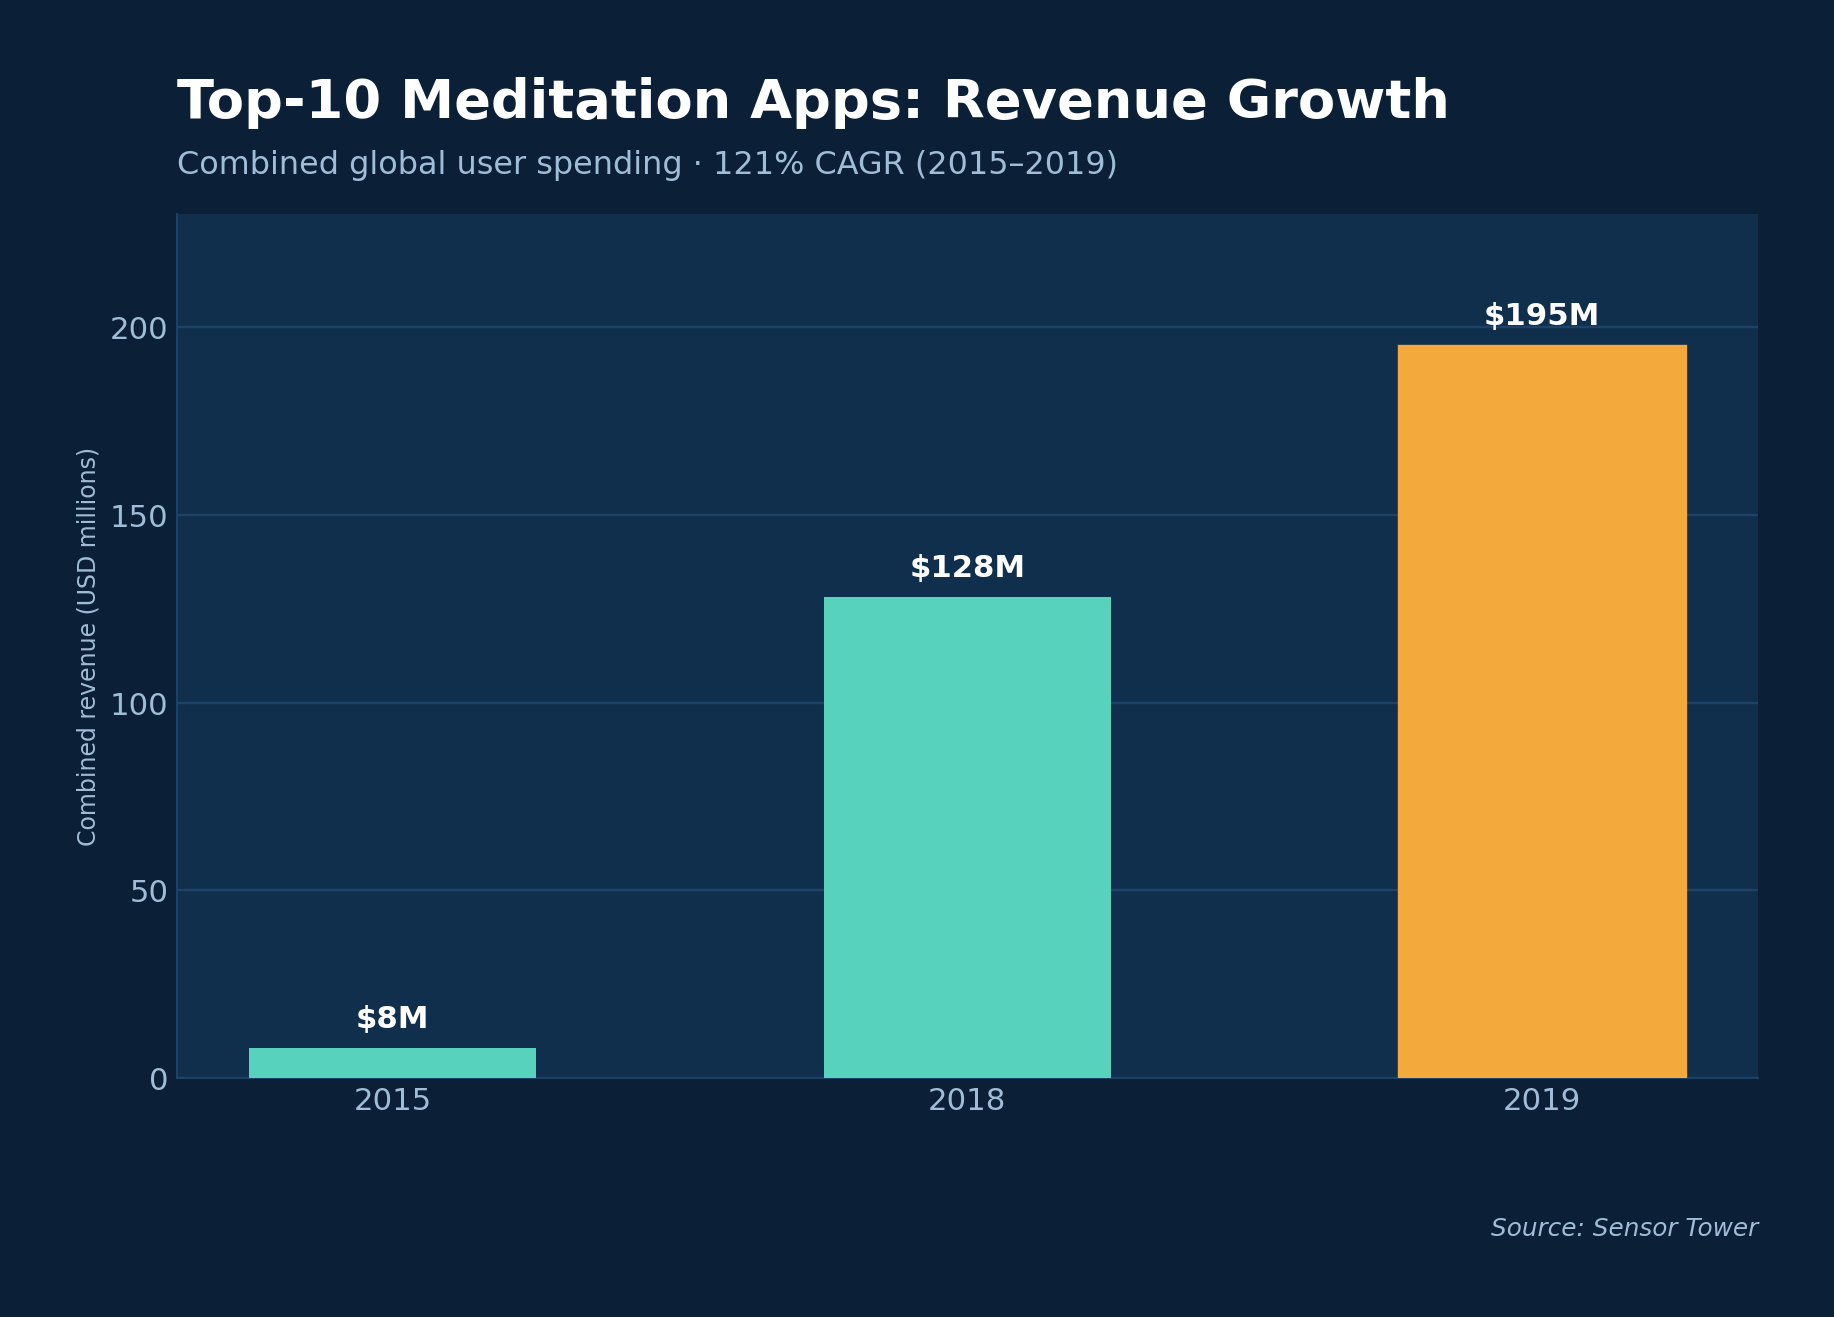
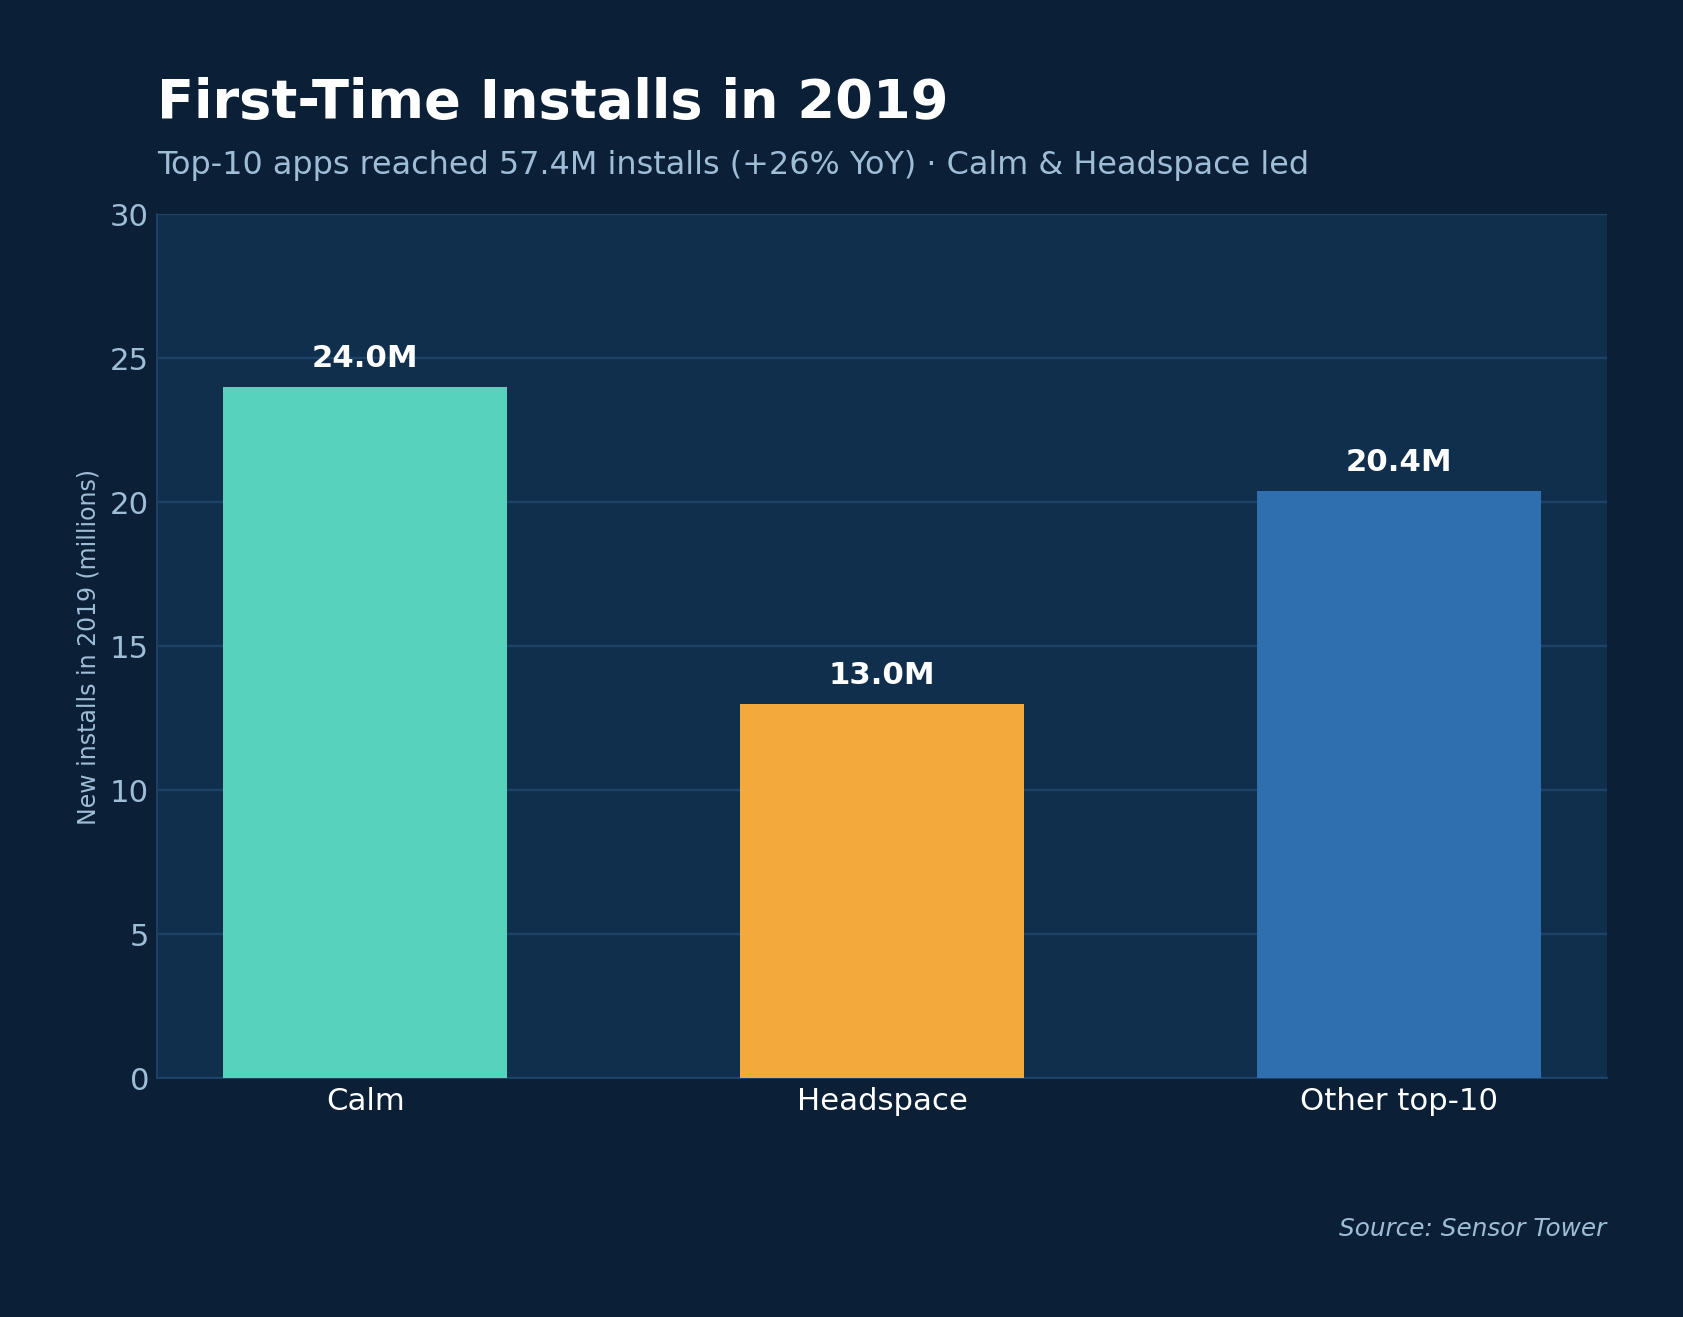
Spending in the top-10 meditation apps grew 52% year-over-year to $195M in 2019, up from ~$8M in 2015 — a 121% five-year CAGR. First-time installs reached 57.4M in 2019 (+26% YoY).
Calm vs Headspace: 2019 revenue and YoY growth. Source: Sensor Tower
First-time installs in 2019. Source: Sensor Tower
Market Leaders
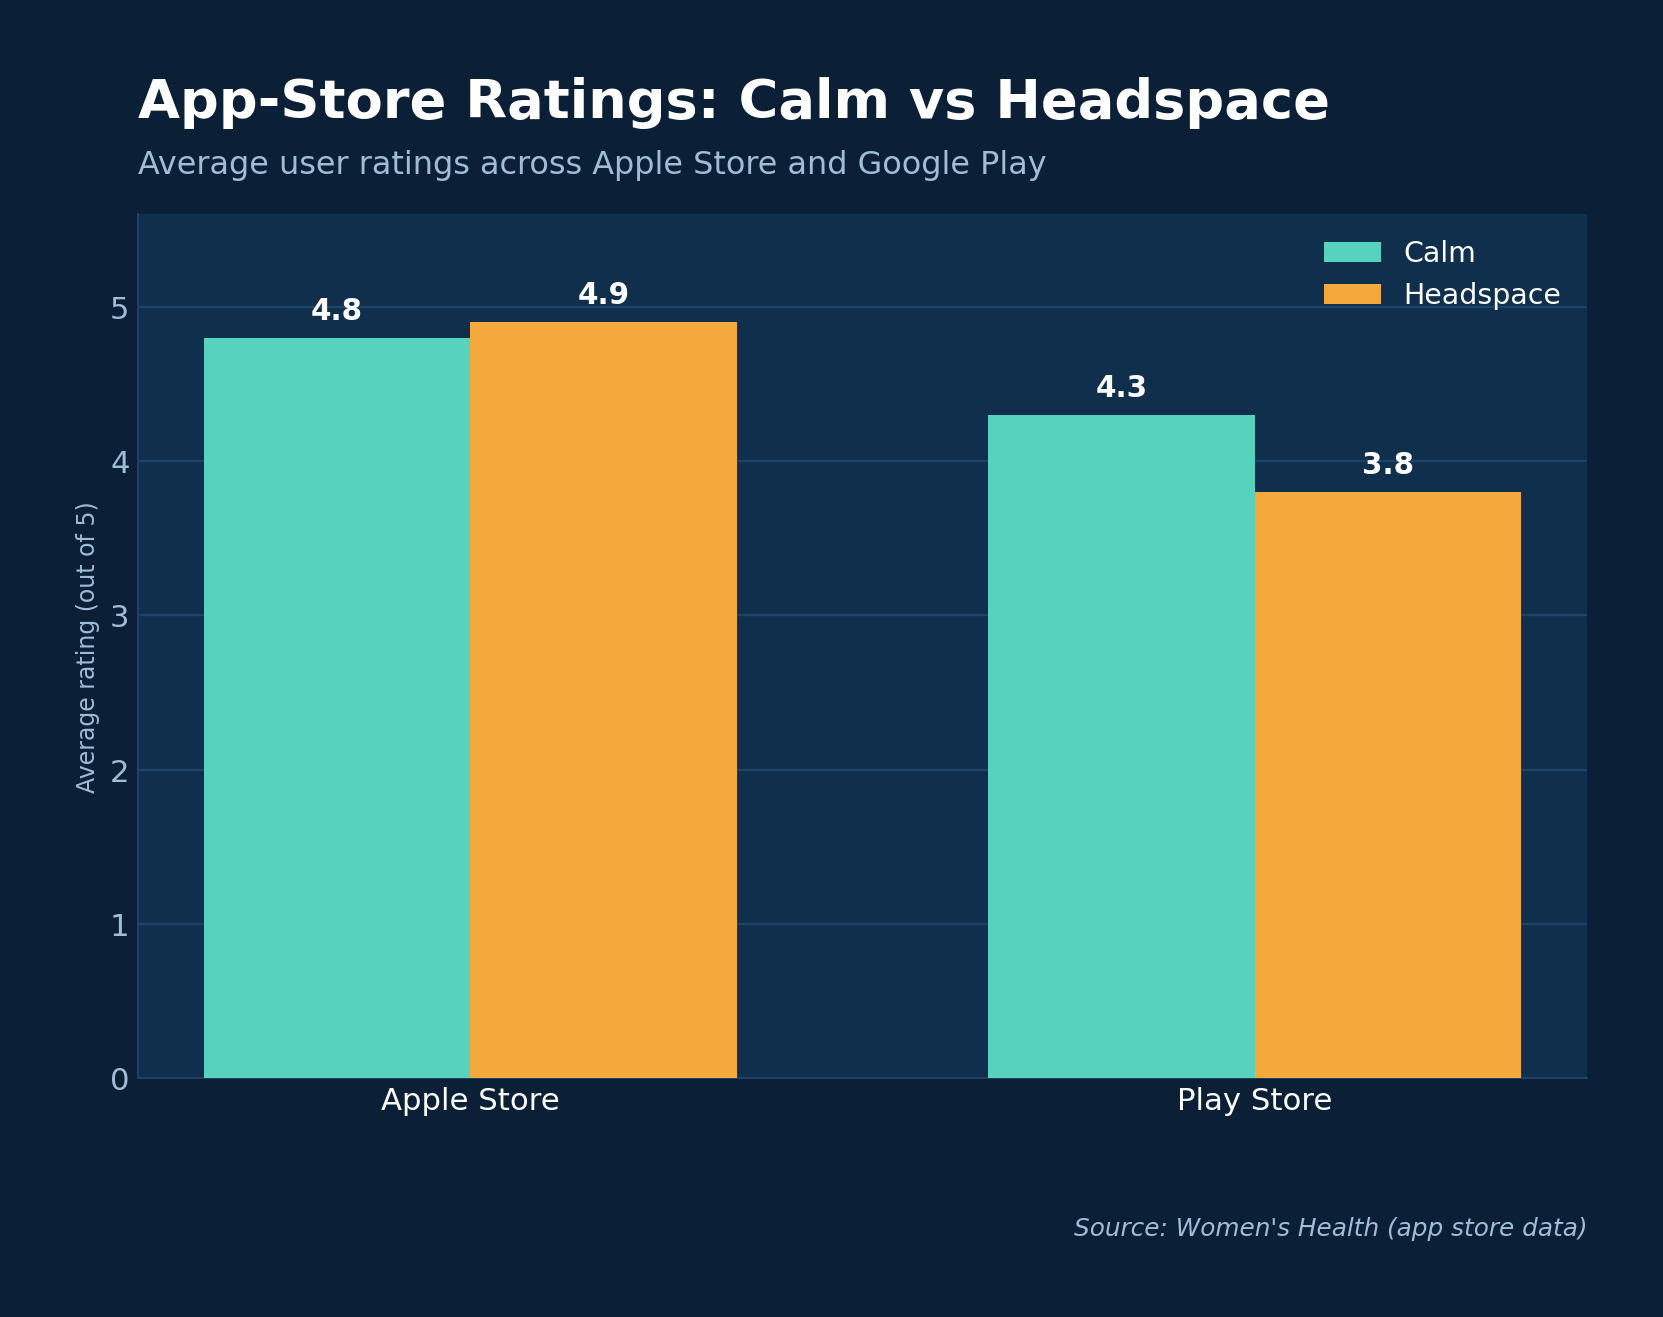
Calm and Headspace dominate on revenue, installs, and brand strength. Both score highly with users across app stores, reinforcing their lead and high switching barriers for newcomers.
App-store ratings: Calm vs Headspace.
Product Differentiation
Leading apps differentiate by content depth and niche. Headspace centers structured courses, focus music, and movement; Calm leads in sleep stories and celebrity narration; Insight Timer offers the largest free library; FitMind leans on science-backed ‘mental fitness’; and Muse adds EEG biofeedback hardware.
Weaknesses • Highly consolidated market • Heavy reliance on subscriptions
Opportunities • Asia Pacific & Middle East growth • Schools, workplaces, wearables
Threats • Low barriers → many new entrants • Free alternatives pressure pricing
COVID-19 Impact
The pandemic accelerated demand as stress, isolation, and remote work pushed more people toward digital mental-wellness tools — strengthening the long-term growth case for meditation apps.
Conclusion
The meditation app market is growing steadily toward $2.1B by 2025, led by Calm and Headspace. The strongest opportunities lie in emerging regions, schools and workplaces, and wearable integration — within a competitive, subscription-driven landscape.
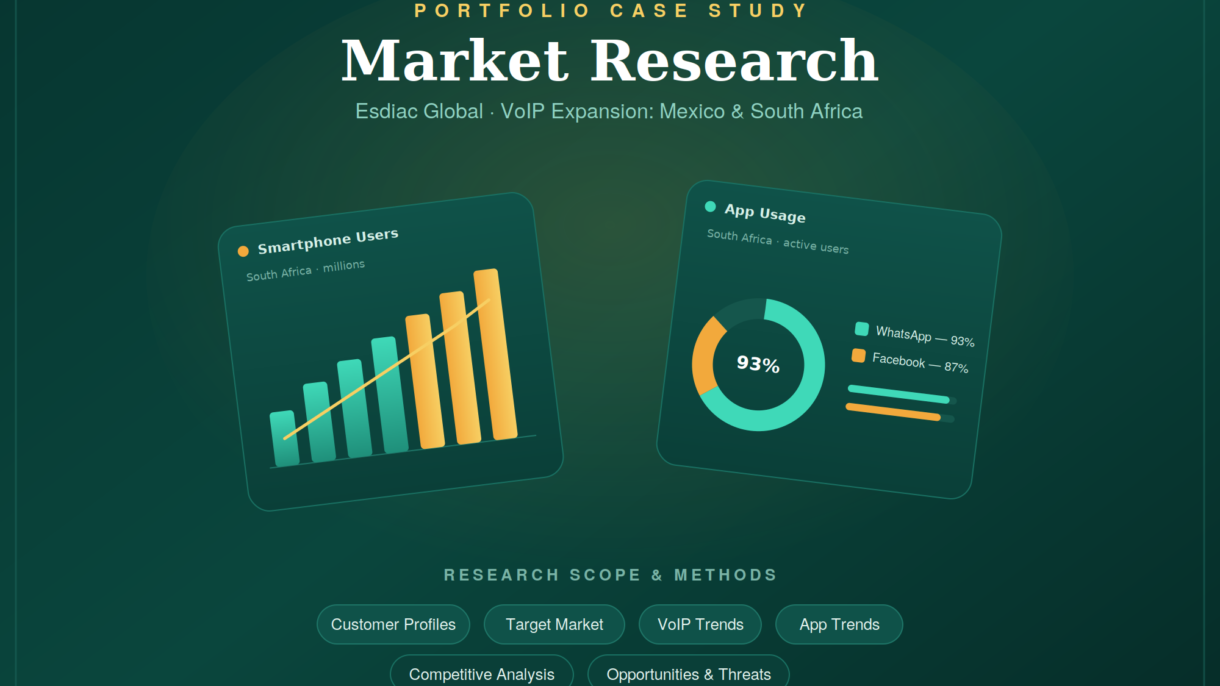
Market Research on Esdiac Global- VoIP & Messaging App
Through in-depth research into the VoIP and messaging app market, we have built a clear customer, competitive, and growth strategy that can be applied across emerging markets like Mexico and South Africa.
VoIP & messaging app expansion into Mexico and South Africa.
Overview
Esdiac is an internet calling and messaging app exploring expansion into two high-growth markets: Mexico and South Africa. This study profiles the customers, defines the target market, maps opportunities and threats, reviews VoIP and app trends, and benchmarks Esdiac against the leading global apps.
Customer Profiles: South Africa
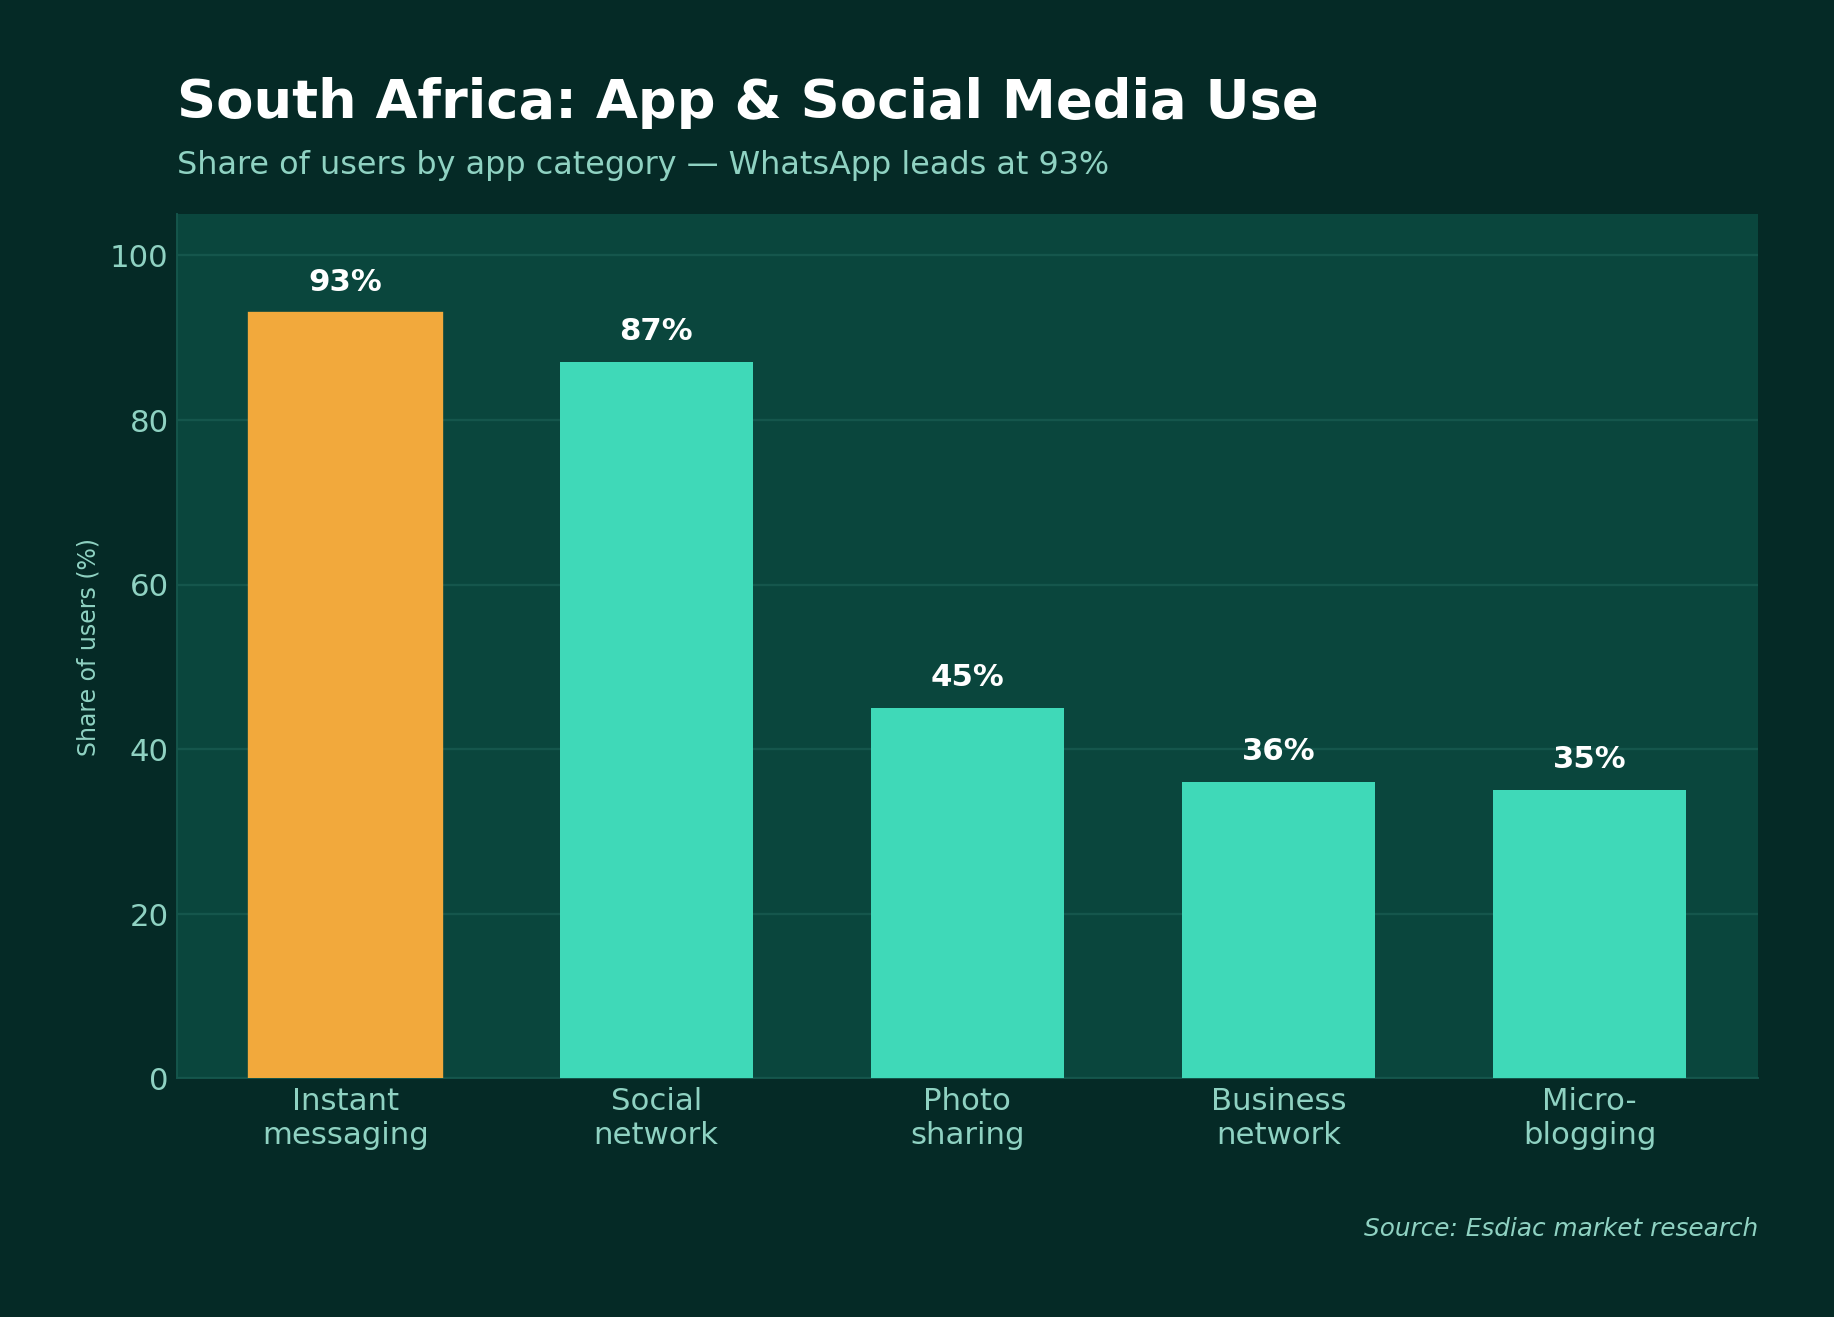
South Africa is strongly mobile-first, with phones driving 71% of web traffic. Messaging and calling are embedded in daily life, and WhatsApp dominates — used actively by nearly half the population. Users skew young (18–29), slightly more male, and better educated.
South Africa: app and social media use by category. Source: Esdiac research
Customer Profiles: Mexico
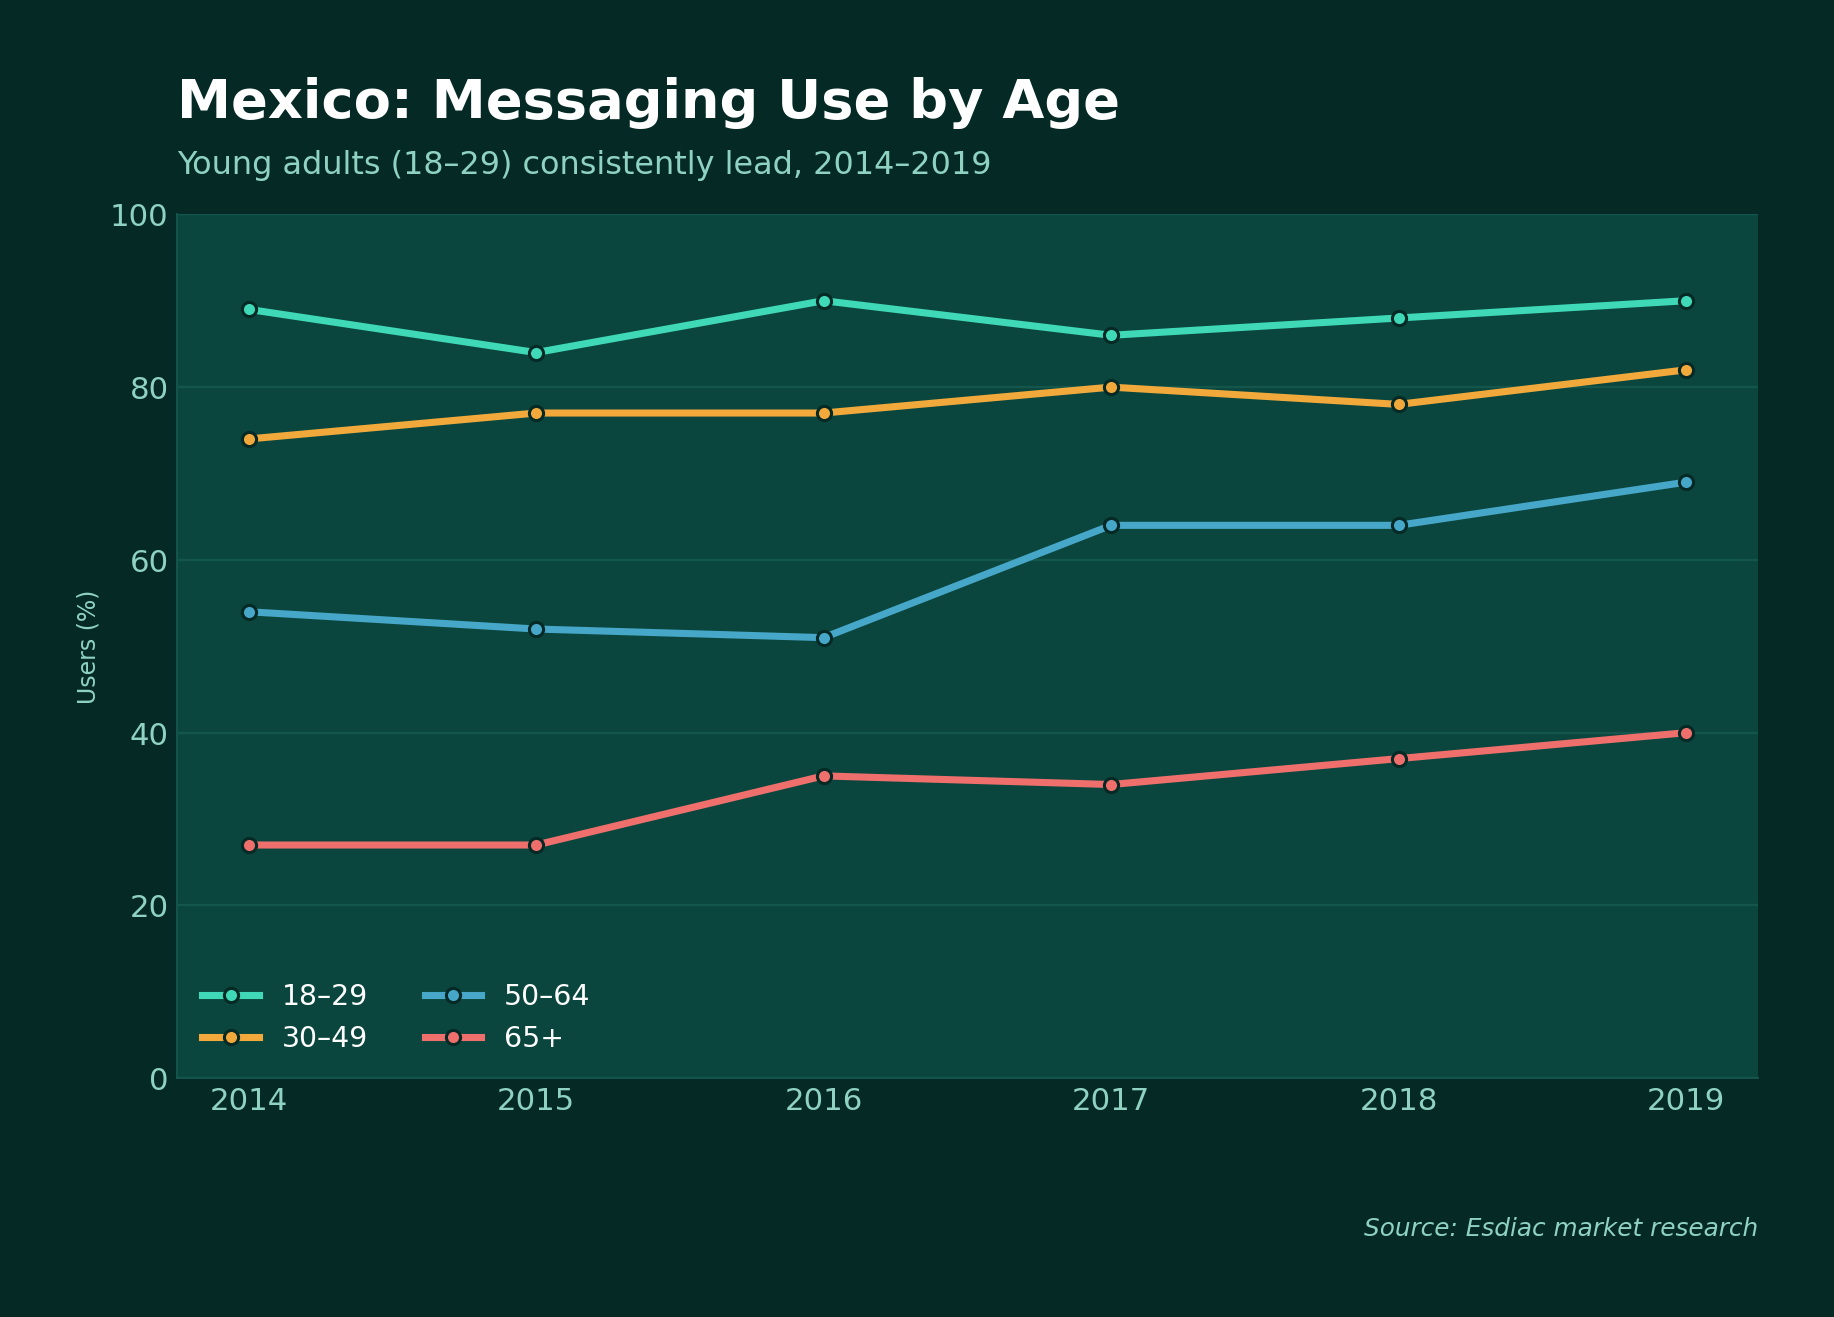
In Mexico, messaging and calling apps are used heavily — many users spend six or more hours a day on them. Notably, female users outnumber male users. Adoption is led by young adults (18–29), college graduates, and urban residents.
Mexico: messaging use by age group, 2014–2019. Source: Esdiac research
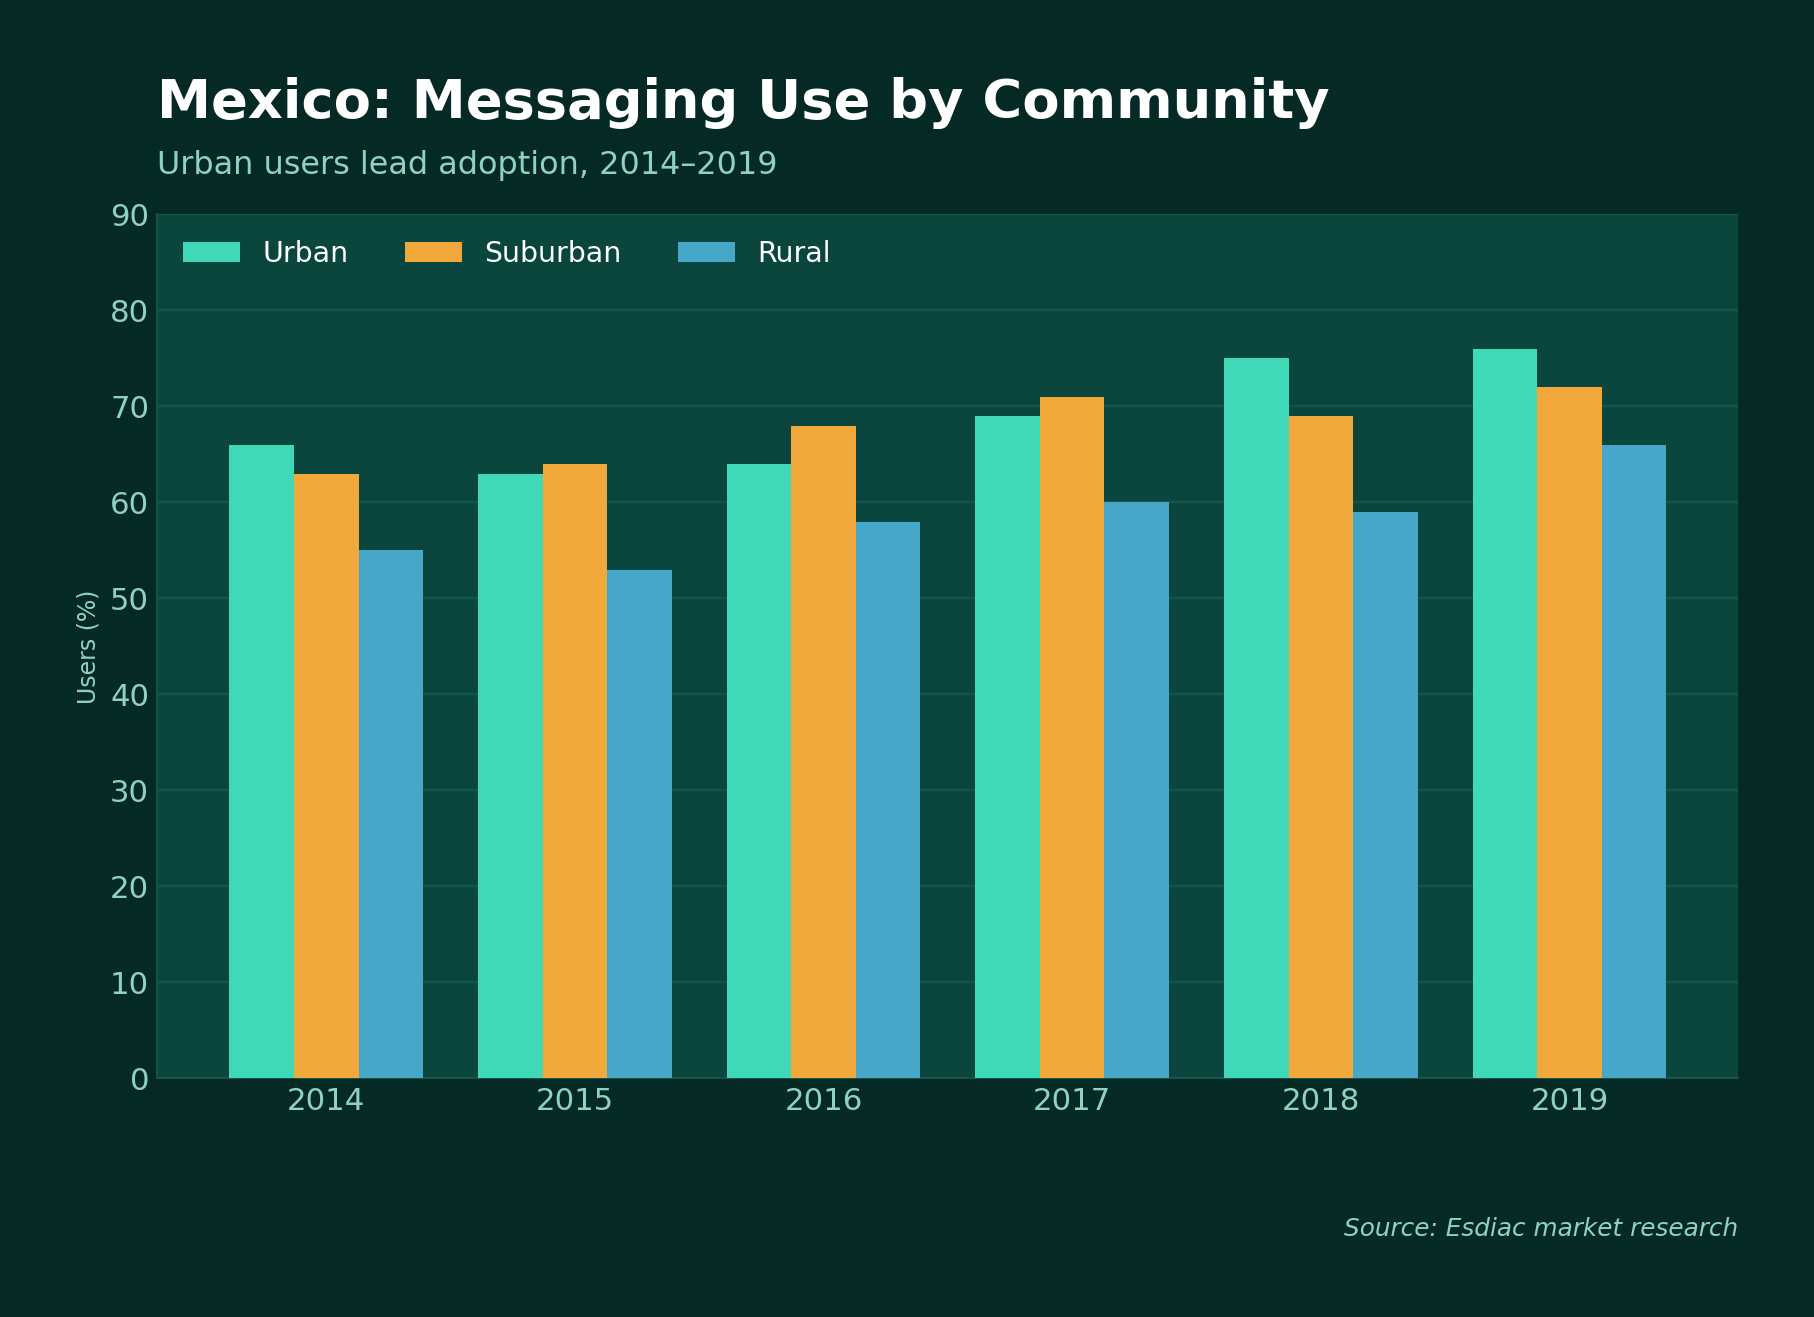
Mexico: messaging use by community, 2014–2019. Source: Esdiac research
Target Market
Age: focus on 18–29 year-olds in both markets — the heaviest users.
Gender: target female users in Mexico and male users in South Africa.
Education: prioritize college-level and above users.
Location: lead with urban populations, where adoption is highest.
Market Opportunities
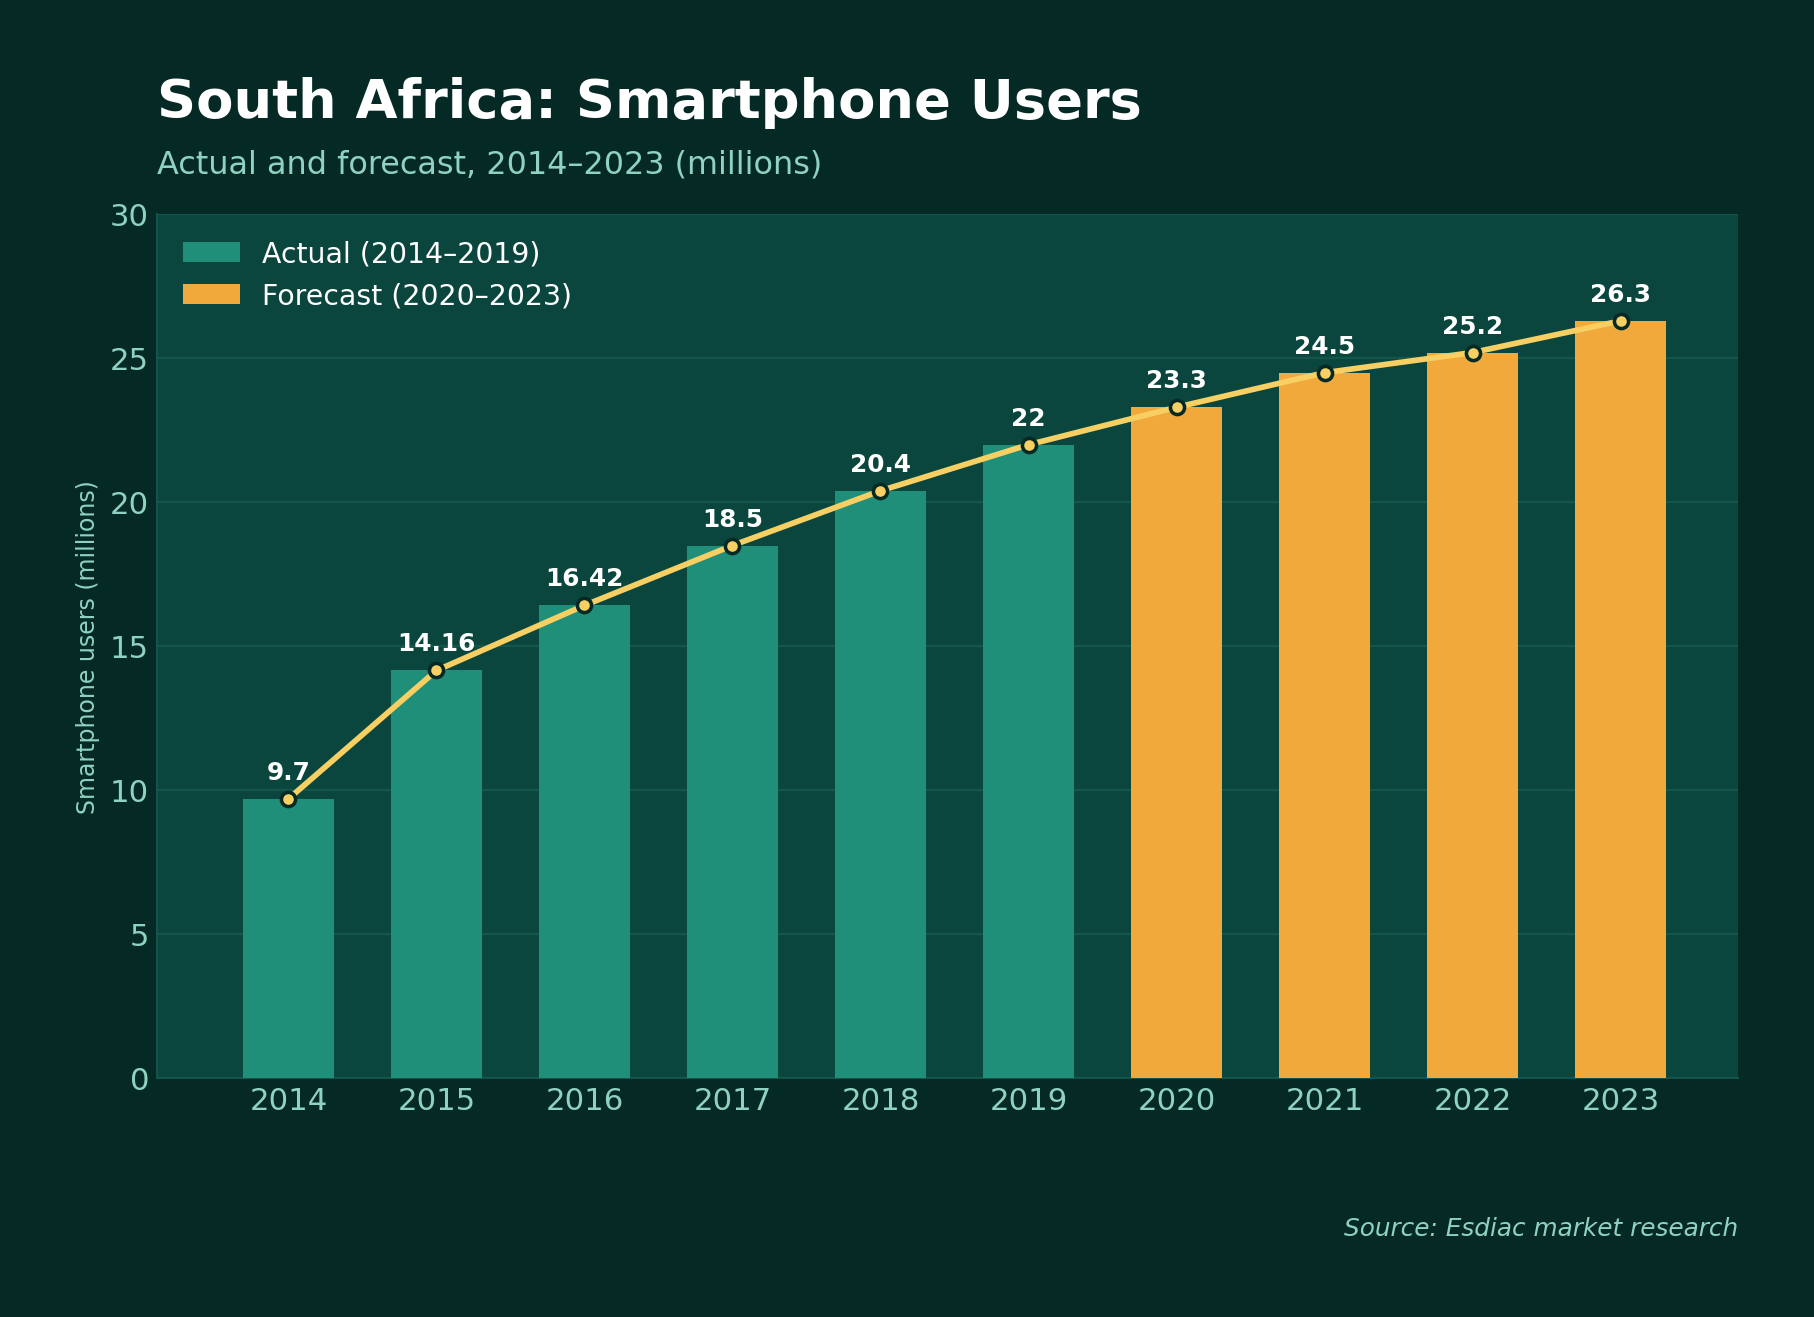
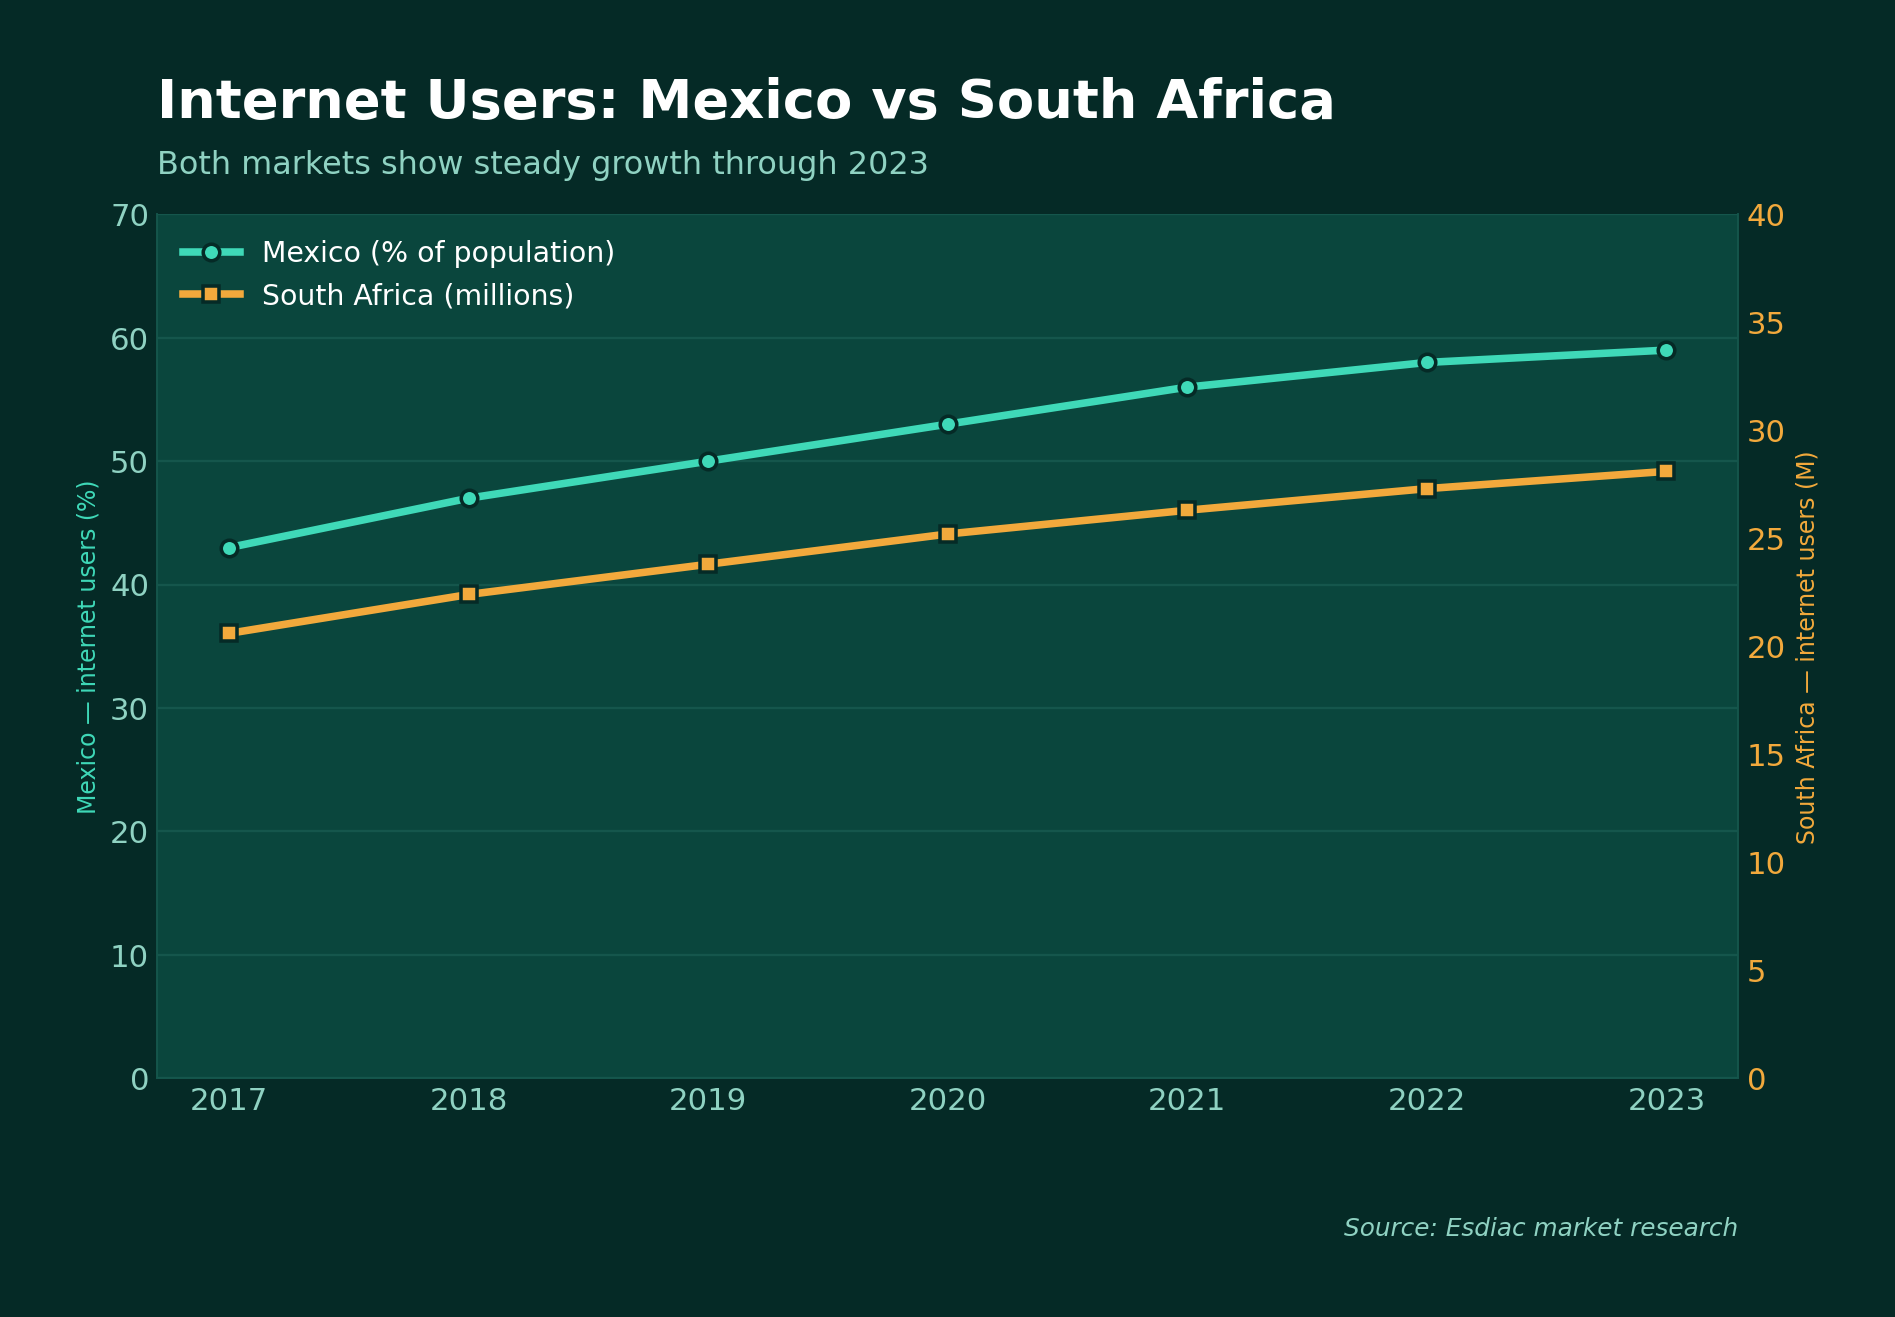
Rising smartphone and internet adoption in both countries widens Esdiac’s potential base. South Africa’s smartphone users are forecast to climb toward 26M by 2023, while internet penetration keeps rising in both markets. Remote-work culture and improved scalability add further room to grow.
South Africa: smartphone users, 2014–2023. Source: Esdiac research
Internet users: Mexico (%) vs South Africa (millions). Source: Esdiac research
Threats
Strong competition from WhatsApp, Viber, Skype, Messenger and others.
Fast-moving technology raises the cost of keeping up.
VoIP restrictions in some countries; security and privacy concerns.
Uneven IT infrastructure (esp. South Africa) and political/economic uncertainty.
VoIP & App Trends
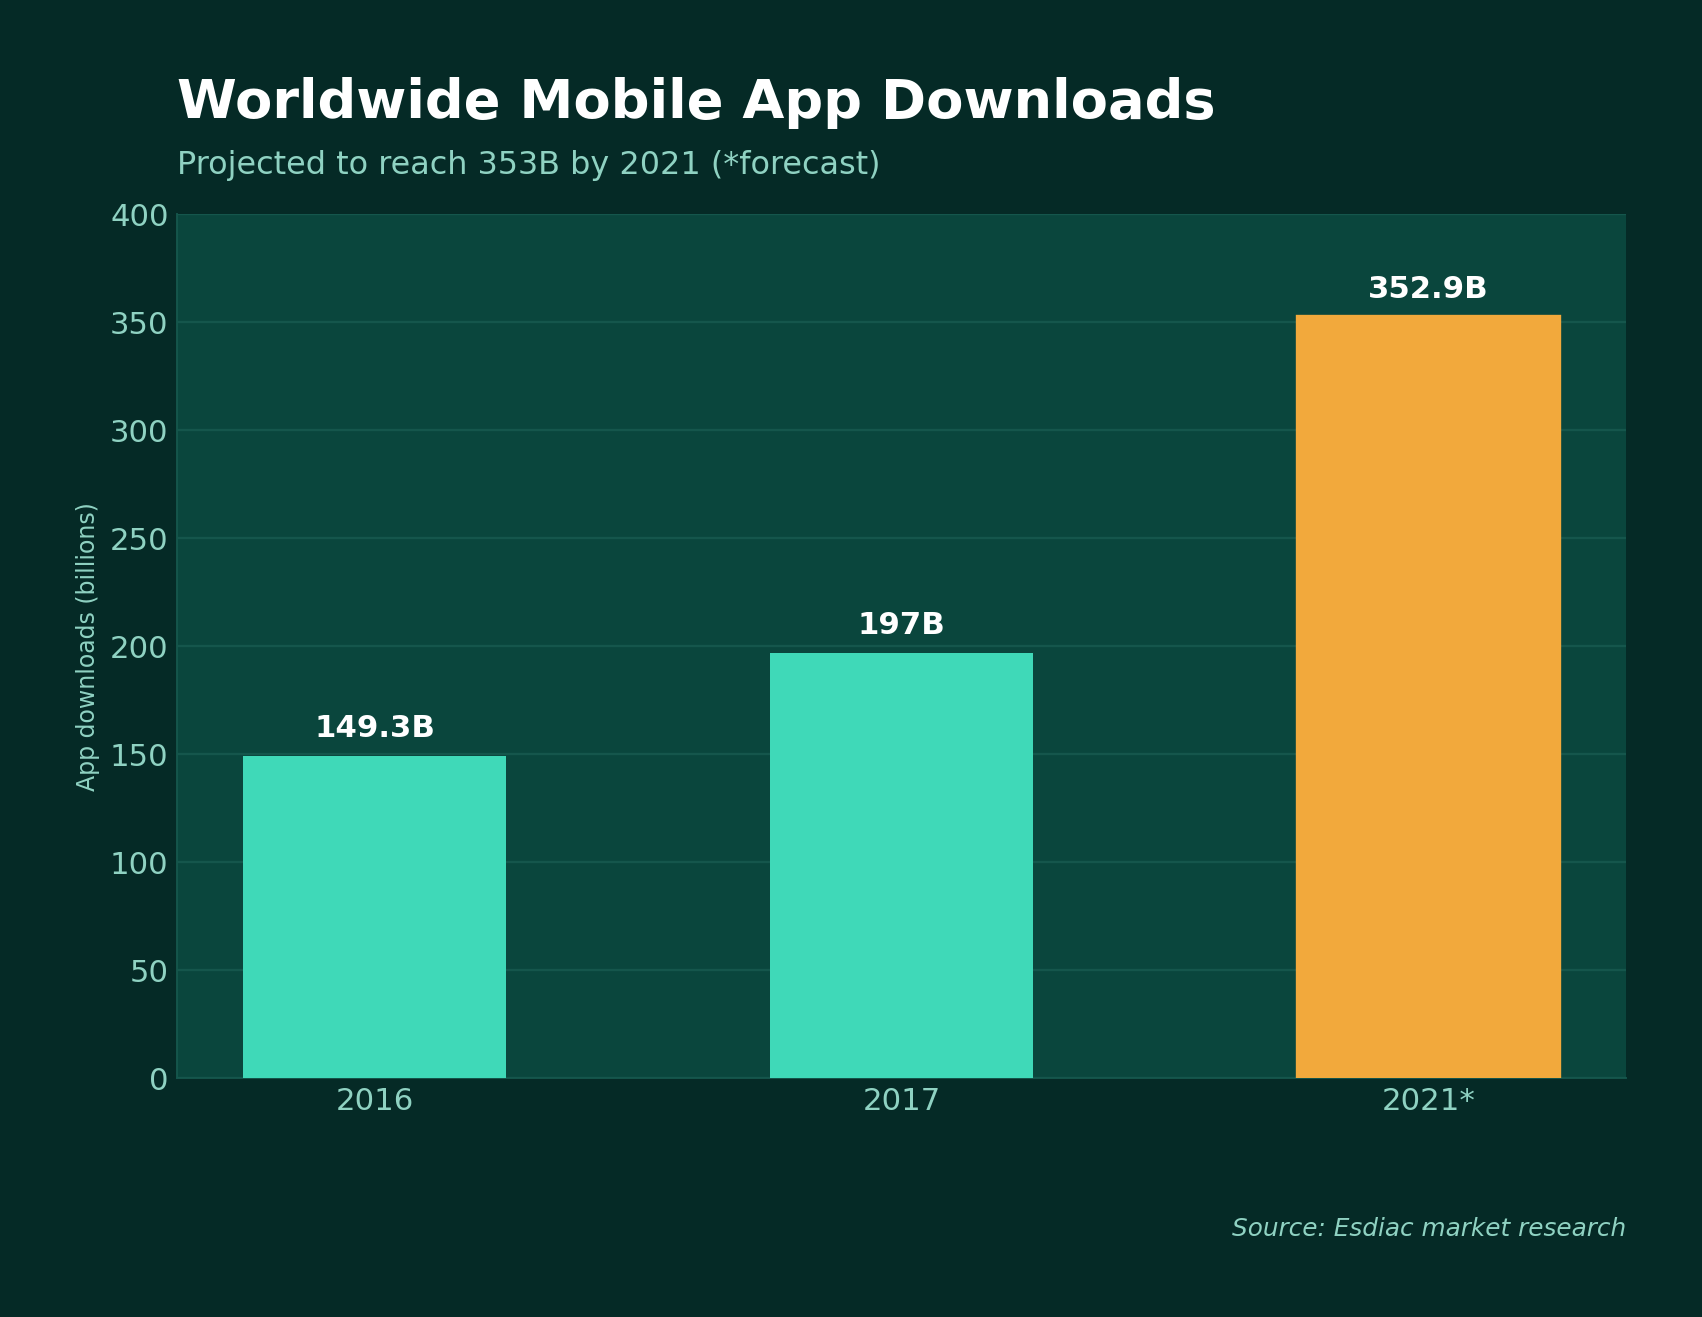
VoIP is maturing fast: in-app and unified communications are spreading, traditional landlines are fading, and 5G plus AI-driven customer service are entering the mainstream. Globally, app downloads are projected to more than double from 149B (2016) to 353B (2021), underscoring strong tailwinds for app-based calling.
Worldwide mobile app downloads (billions). Source: Esdiac research
Competitive Analysis
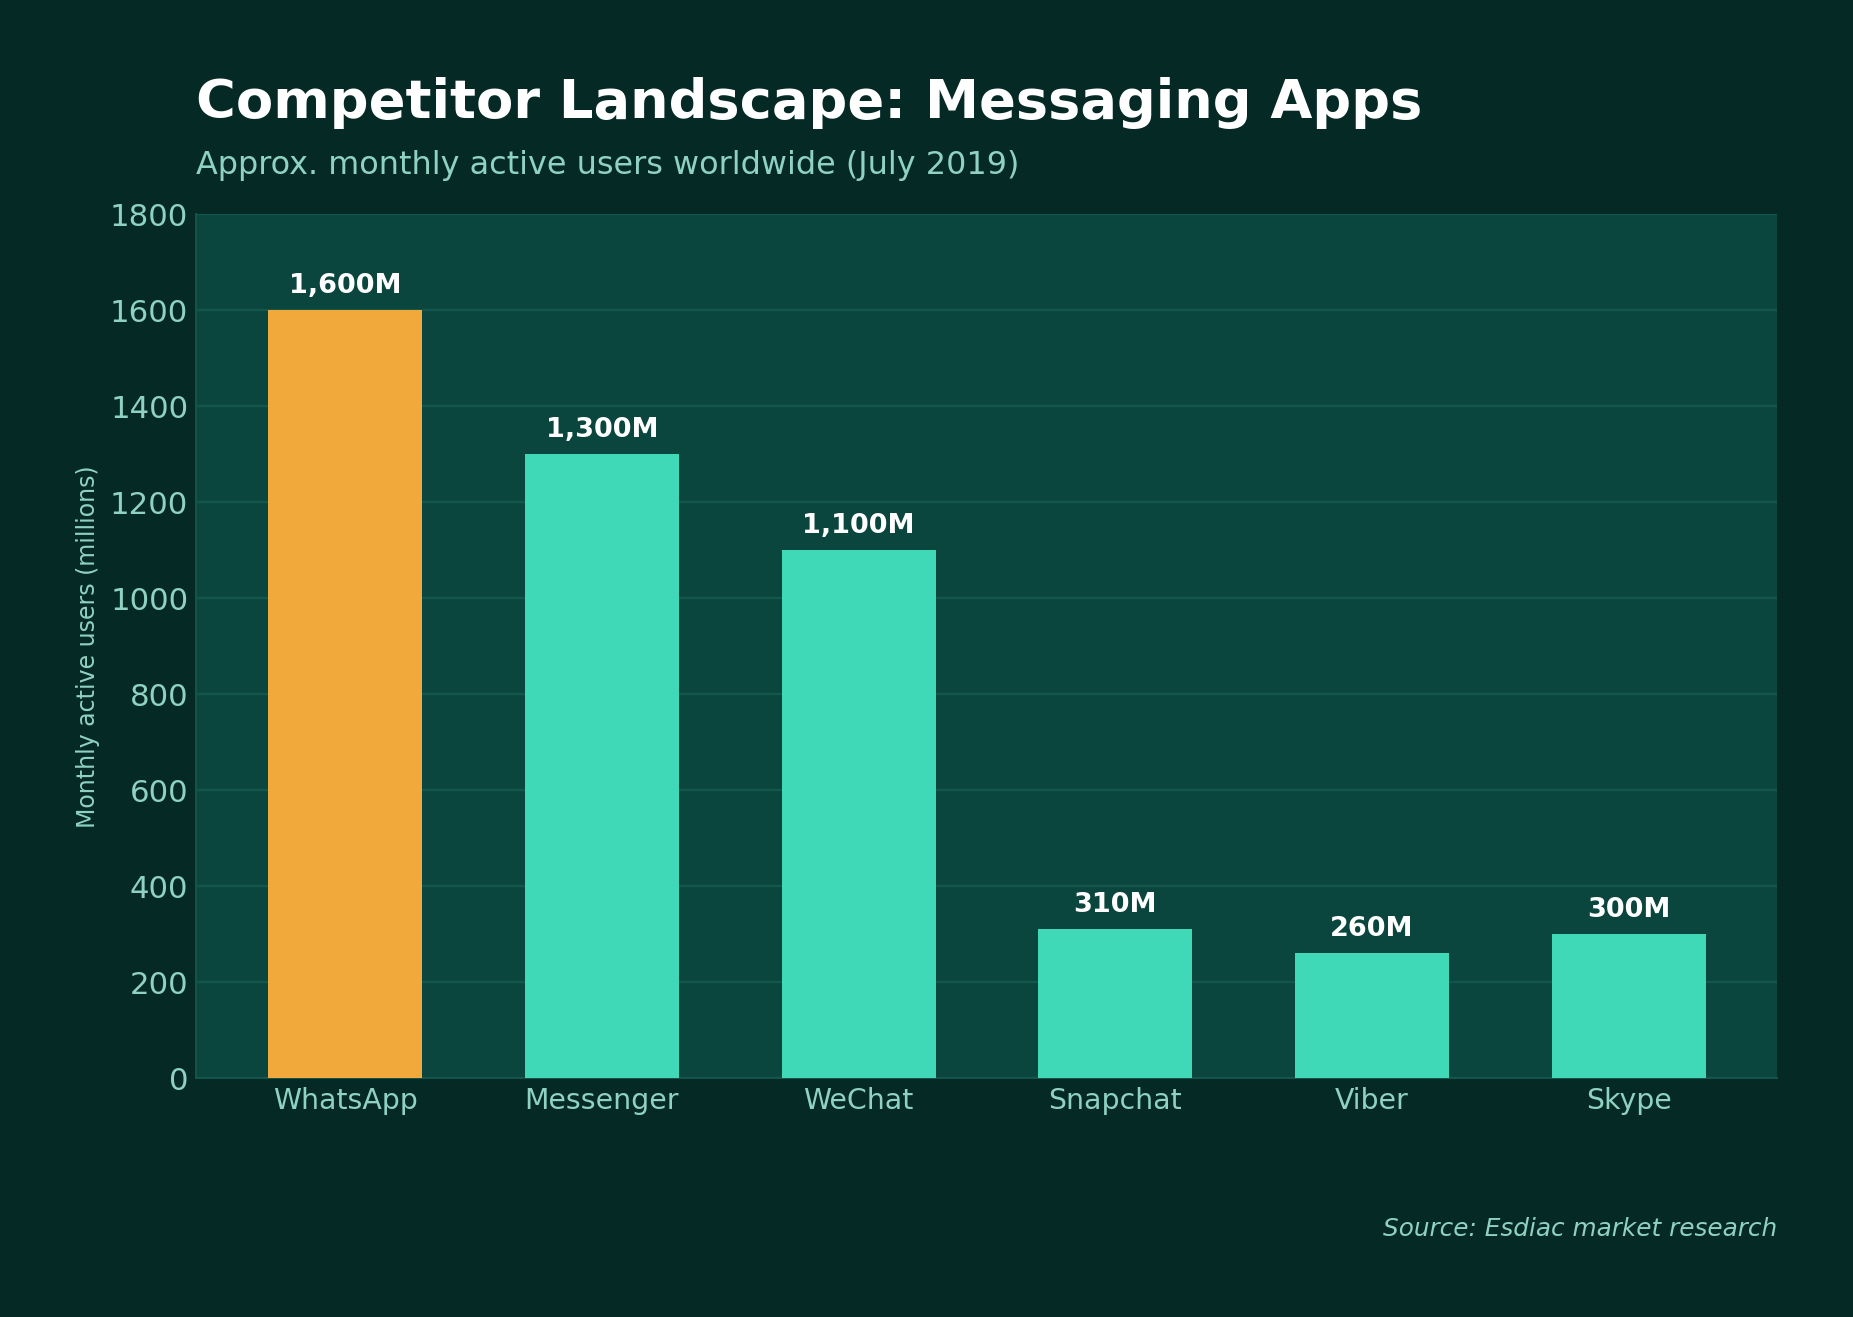
Esdiac competes with established global apps. Its differentiator is the ability to call internationally to contacts who do not have the app, at low rates. Gaps versus rivals include group chats, chatbots, desktop/tablet support, and broader feature sets offered by WhatsApp, Messenger, WeChat, Snapchat, Viber, and Skype.
Competitor landscape: approx. monthly active users (July 2019). Source: Esdiac research
Esdiac vs Competitors — Snapshot
Feature
Esdiac position
Low-cost intl calls
Strength — calls contacts even without the app
Group chats
Gap — not yet supported (rivals allow large groups)
Chatbots
Gap — no chatbot/automation features yet
Desktop / tablet
Gap — mobile only (Viber/Skype work cross-device)
Video quality
Competitive — high quality, but charged
Growth Strategy
Lead with digital channels — social media and YouTube ads — supported by a clear, well-designed website. Use sign-up promotions (e.g. free calling credit) and rely on word-of-mouth from satisfied users. Back it with reliable 24/7 support staffed by skilled, adaptable, customer-friendly people.
Conclusion
Mexico and South Africa offer strong, growing markets for Esdiac, driven by rising smartphone and internet use and young, urban, educated audiences. Success depends on sharp targeting, closing key feature gaps versus rivals, and a digital-first, word-of-mouth growth strategy.
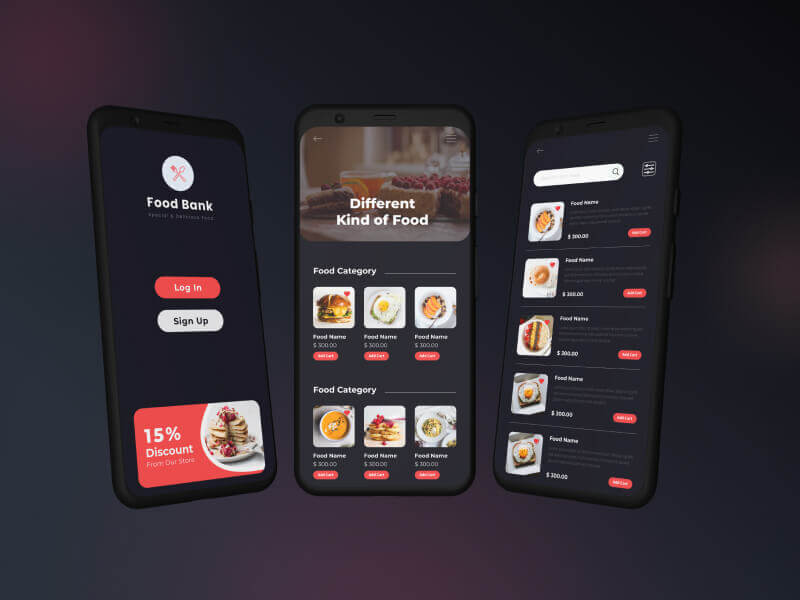
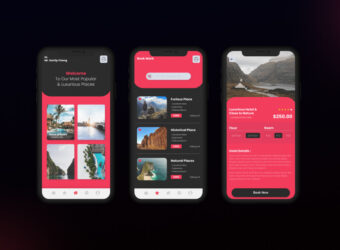
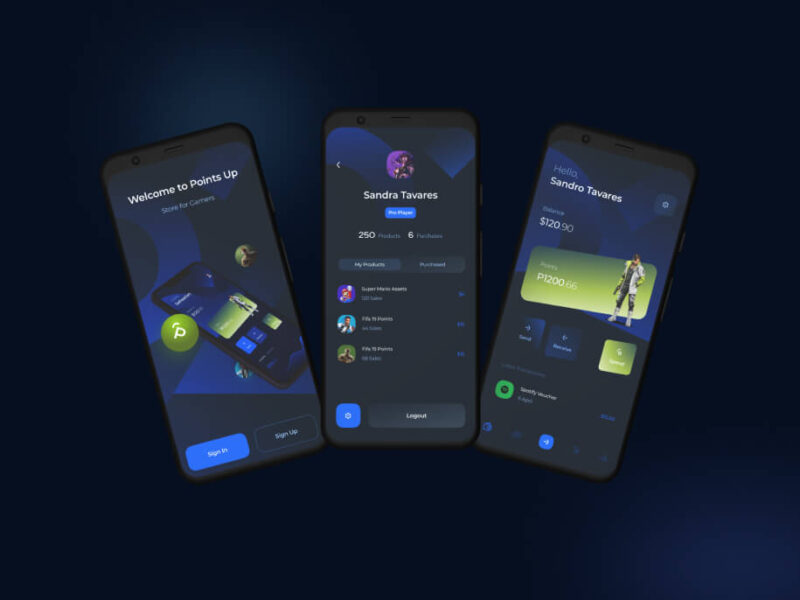
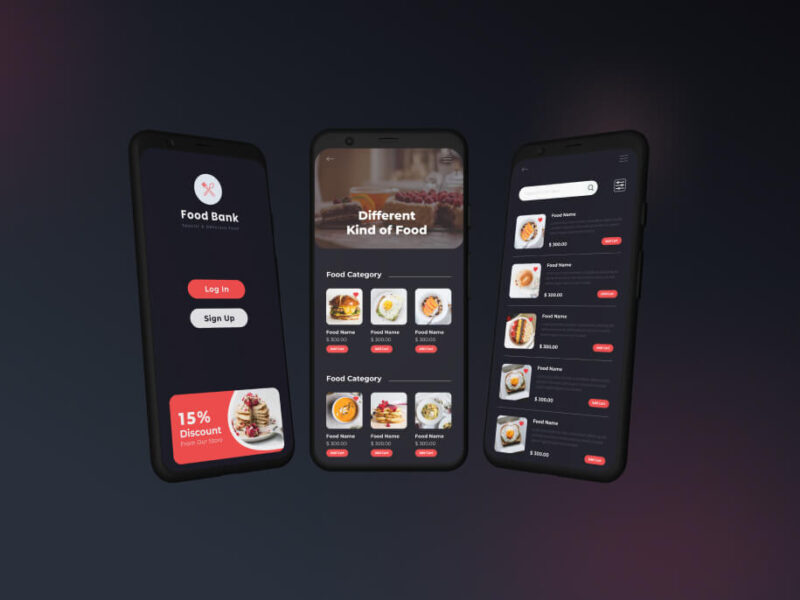
Through a wide variety of mobile applications, we’ve developed a unique visual system and strategy that can be applied across the spectrum of available applications.
Lorem ipsum dolor sit amet, consectetur adipiscing elit, sed do eiusmod tempor incididunt ut labore et dolore magna aliqua. Quis ipsum suspendisse ultrices gravida. Risus commod viverra maecenas accumsan lacus vel facilisis. ut labore et dolore magna aliqua.
There are always some stocks, which illusively scale lofty heights in a given time period. However, the good show doesn’t last for these overblown toxic stocks as their current price is not justified by their fundamental strength.
Toxic companies are usually characterized by huge debt loads and are vulnerable to external shocks. Accurately identifying such bloated stocks and getting rid of them at the right time can protect your portfolio.
Overpricing of these toxic stocks can be attributed to either an irrational enthusiasm surrounding them or some serious fundamental drawbacks. If you own such bubble stocks for an inordinate period of time, you are bound to see a massive erosion of wealth.
However, if you can precisely spot such toxic stocks, you may gain by resorting to an investing strategy called short selling. This strategy allows one to sell a stock first and then buy it when the price falls.
While short selling excels in bear markets, it typically loses money in bull markets.
So, just like identifying stocks with growth potential, pinpointing toxic stocks and offloading them at the right time is crucial to guard one’s portfolio from big losses or make profits by short selling them. Heska Corporation HSKA, Tandem Diabetes Care, Inc. TNDM, Credit Suisse Group CS,Zalando SE ZLNDY and Las Vegas Sands LVS are a few such toxic stocks.Screening Criteria
Here is a winning strategy that will help you to identify overhyped toxic stocks:
Most recent Debt/Equity Ratio greater than the median industry average: High debt/equity ratio implies high leverage. High leverage indicates a huge level of repayment that the company has to make in connection with the debt amount.
Through a wide variety of mobile applications, we’ve developed a unique visual system and strategy that can be applied across the spectrum of available applications.
Most recent Debt/Equity Ratio greater than the median industry average: High debt/equity ratio implies high leverage. High leverage indicates a huge level of repayment that the company has to make in connection with the debt amount.
There are always some stocks, which illusively scale lofty heights in a given time period. However, the good show doesn’t last for these overblown toxic stocks as their current price is not justified by their fundamental strength.
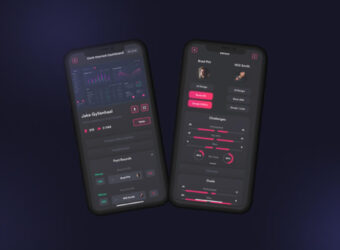
Strategy
A strategy is a general plan to achieve one or more long-term. labore et dolore magna aliqua.
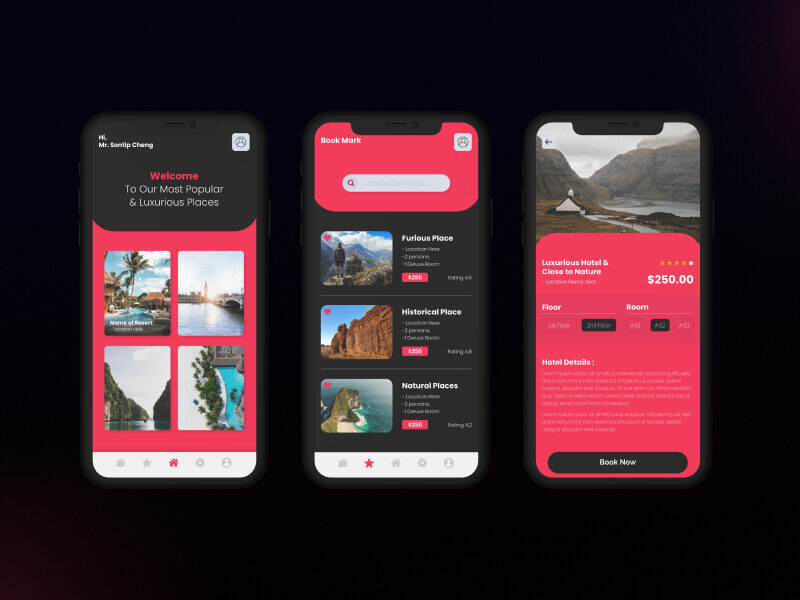
Design
UI/UX Design, Art Direction, A design is a plan or specification for art. which illusively scale lofty heights.
User Experience
User experience (UX) design is the process design teams use to create products that provide.
Toxic companies are usually characterized by huge debt loads and are vulnerable to external shocks. Accurately identifying such bloated stocks and getting rid of them at the right time can protect your portfolio.
Overpricing of these toxic stocks can be attributed to either an irrational enthusiasm surrounding them or some serious fundamental drawbacks. If you own such bubble stocks for an inordinate period of time, you are bound to see a massive erosion of wealth.
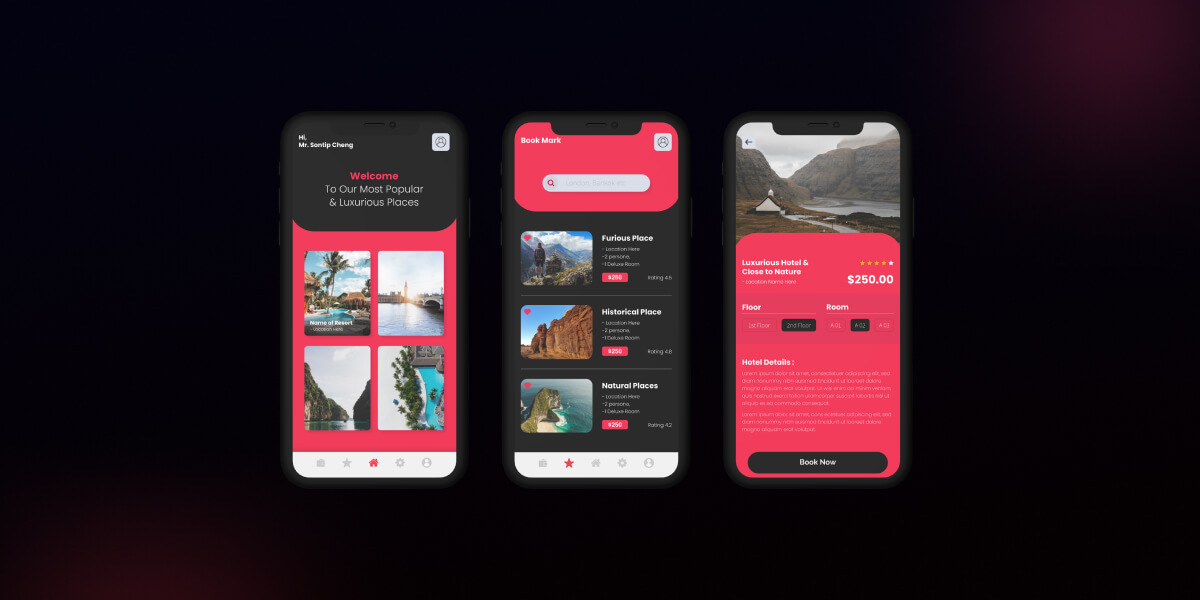
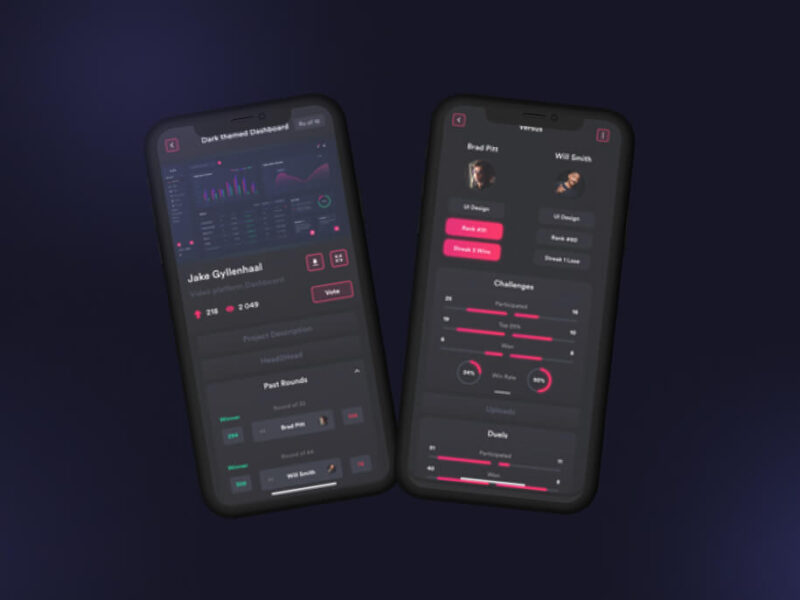
Screen OneScreen Two
However, if you can precisely spot such toxic stocks, you may gain by resorting to an investing strategy called short selling. This strategy allows one to sell a stock first and then buy it when the price falls.
While short selling excels in bear markets, it typically loses money in bull markets.
So, just like identifying stocks with growth potential, pinpointing toxic stocks and offloading them at the right time is crucial to guard one’s portfolio from big losses or make profits by short selling them. Heska Corporation HSKA, Tandem Diabetes Care, Inc. TNDM, Credit Suisse Group CS,Zalando SE ZLNDY and Las Vegas Sands LVS are a few such toxic stocks.Screening Criteria
Here is a winning strategy that will help you to identify overhyped toxic stocks:
Most recent Debt/Equity Ratio greater than the median industry average: High debt/equity ratio implies high leverage. High leverage indicates a huge level of repayment that the company has to make in connection with the debt amount.